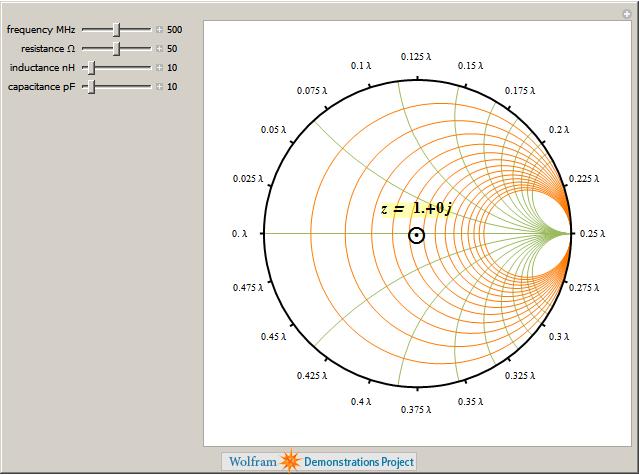
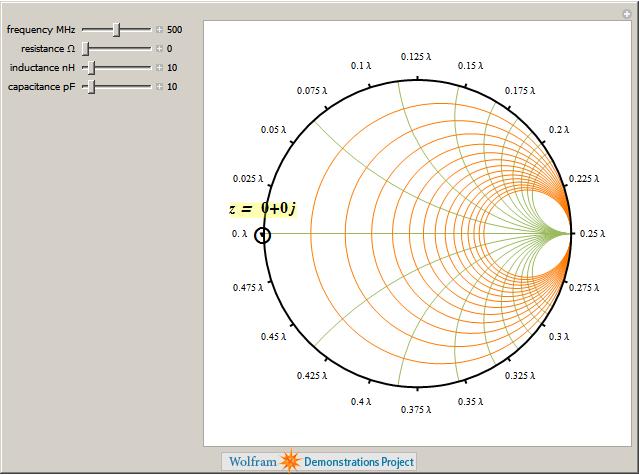
The Smith Chart  Snapshot 2: increasing inductive reactance (by increasing  or or  ) gives a clockwise rotation about a red circle contour; increasing capacitive reactance would result in a counterclockwise rotation ) gives a clockwise rotation about a red circle contour; increasing capacitive reactance would result in a counterclockwise rotationA more complete, full-scale Smith chart is given on this website. See also: P. H. Smith, Electronic Applications of the Smith Chart in Waveguide: Circuit and Component Analysis, 2nd ed., Raleigh, NC: SciTech Publishing, 2000.  "The Smith Chart" from The Wolfram Demonstrations Project http://demonstrations.wolfram.com/TheSmithChart/ Contributed by: S. M. Blinder |


|
|||||||||||||


 Browse all topics


