Skip to contentSkip to navigation

Connexions

You are here: Home » Content » Simple Calculations with the Smith Chart

Navigation

Lenses

What is a lens?

Definition of a lens

Lenses

A lens is a custom view of the content in the repository. You can think of it as a fancy kind of list that will let you see content through the eyes of organizations and people you trust.

What is in a lens?

Lens makers point to materials (modules and collections), creating a guide that includes their own comments and descriptive tags about the content.

Who can create a lens?

Any individual member, a community, or a respected organization.

What are tags? tag icon

Tags are descriptors added by lens makers to help label content, attaching a vocabulary that is meaningful in the context of the lens.

This content is ...

Affiliated with (What does "Affiliated with" mean?)

This content is either by members of the organizations listed or about topics related to the organizations listed. Click each link to see a list of all content affiliated with the organization.
  • OrangeGrove display tagshide tags

    This module is included inLens: Florida Orange Grove Textbooks
    By: Florida Orange GroveAs a part of collection: "Introduction to Physical Electronics"

    Click the "OrangeGrove" link to see all content affiliated with them.

    Click the tag icon tag icon to display tags associated with this content.

  • Rice Digital Scholarship display tagshide tags

    This module is included in aLens by: Digital Scholarship at Rice UniversityAs a part of collection: "Introduction to Physical Electronics"

    Click the "Rice Digital Scholarship" link to see all content affiliated with them.

    Click the tag icon tag icon to display tags associated with this content.

  • Featured Content display tagshide tags

    This module is included inLens: Connexions Featured Content
    By: ConnexionsAs a part of collection: "Introduction to Physical Electronics"

    Comments:

    "This course offers an introduction to solid state device including field effect and bipolar transistors. Properties of transmission lines and propagating E&M waves are also presented. It is […]"

    Click the "Featured Content" link to see all content affiliated with them.

    Click the tag icon tag icon to display tags associated with this content.

Also in these lenses

  • Lens for Engineering

    This module is included inLens: Lens for Engineering
    By: Sidney Burrus

    Click the "Lens for Engineering" link to see all content selected in this lens.

  • ElectroEngr display tagshide tags

    This module is included inLens: Electronic Engineering
    By: Richard LloydAs a part of collection: "Introduction to Physical Electronics"

    Click the "ElectroEngr" link to see all content selected in this lens.

    Click the tag icon tag icon to display tags associated with this content.

Recently Viewed

Tags

(What is a tag?)

These tags come from the endorsement, affiliation, and other lenses that include this content.
Download
x

Download module as:

  • PDF
  • EPUB (what's this?)

    What is an EPUB file?

    EPUB is an electronic book format that can be read on a variety of mobile devices.

    Downloading to a reading device

    For detailed instructions on how to download this content's EPUB to your specific device, click the "(what's this?)" link.

  • More downloads ...
Reuse / Edit
x

Module:

Add to a lens
x

Add module to:

Add to Favorites
x

Add module to:


Simple Calculations with the Smith Chart

Module by: Bill Wilson. E-mail the author

User rating (How does the rating system work?)
Ratings

Ratings allow you to judge the quality of modules. If other users have ranked the module then its average rating is displayed below. Ratings are calculated on a scale from one star (Poor) to five stars (Excellent).

How to rate a module

Hover over the star that corresponds to the rating you wish to assign. Click on the star to add your rating. Your rating should be based on the quality of the content. You must have an account and be logged in to rate content.

:
(0 ratings)

Summary: Instructions on how to use the Smith Chart for simple calculations such as converting from admittance to impedance.

Note: Your browser may not currently support MathML. Chrome will attempt to display MathML, but it should not be considered correct. See our browser support page for additional details. You can always view the correct math in the PDF version.

So, what do we do for ZL? A quick glance at a transmission line problem shows that at the load we have a resistor and an inductor in parallel. This was done on purpose, to show you one of the powerful aspects of the Smith Chart. Based on what you know from circuit theory you would calculate the load impedance by using the formula for two impedances in parallel ZL=

ωLR
ωL+R
which will be somewhat messy to calculate.

Let's remember the formula for what the Smith Chart represents in terms of the phasor r(s).

ZL
Z0
=
1+r(s)
1r(s)
(1)
Let's invert this expression
ZL
Z0
=
1
ZL
1
Z0
=
YL
Y0
=
1r(s)
1+r(s)
(2)
Equation 3 says that is we want to get an admittance instead of an impedance, all we have to do is substitute (r(s)) for r(s) on the Smith Chart plane!
Y0 =
1
Z0
=
1
50
= 0.02
(3)
in our case. We have two elements in parallel for the load (YL=Y+B), so we can easily add their admittances, normalize them to Y0, put them on the Smith Chart, go 180° around (same thing as letting (r(s))=r(s)) and read off
ZL
Z0
. For a 200Ω resistor, G, the condunctance equals
1
200
=0.005
. Y0=0.02 so
G
Y0
=0.25
. The generator is operating at a frequency of <apply>200MHz</apply>, so ω=2πf=1.25×10⁹s-1 and the inductor has a value of 160nH, so ωL=200 and B=
1
ωL
=-0.005
and
B
Y0
=-0.25
.

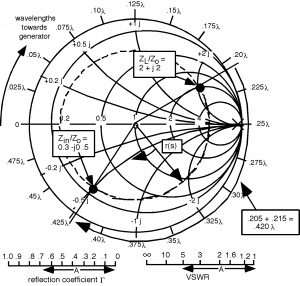
We plot this on the Smith Chart by first finding the real part = 0.25 circle, and then we go down onto the lower half of the chart since that is where all the negative reactive parts are, and we find the curve which represents -0.25 and where they intersect, we put a dot, and mark the location as

YL
Y0
. Now to find
ZL
Z0
, we simply reflect half way around to the opposite side of the chart, which happens to be about
YL
Y0
=2+2
, and we mark that as well. Note that we can take the length of the line from the center of the Smith Chart to our
ZL
Z0
and move it down to the |Γ| scale and find that the reflection coefficient has a magnitude of about 0.6. On a real Smith Chart, there is also a phase angle scale on the outside of the circle (where our distance scale is) which you can use to read off the phase angle of the reflection coefficient as well. Putting that scale on the "mini Smith Chart" would clog things up too much, but the phase angle of Γ is about 3.0°.
Figure 1
Moving Down the Transmission Line
Moving Down the Transmission Line (804.png)

Now the wavelength of the signal on the line is given as

λ =
νp
f
=
2.8×10⁸
200×106
= 1m
(4)
The input to the line is located 21.5cm or 0.215λ away from the load. Thus, we start at
ZL
Z0
, and rotate around on a circle of constant radius a distance 0.215λ towards the generator. To do this, we extend a line out from our
ZL
Z0
point to the scale and read a relative distance of 0.208λ. We add 0.215λ to this, and get 0.423λ Thus, if we rotate around the Smith Chart, on our circle of constant radius Since, after all, all we are doing is following r(s) as it rotates around from the load to the input to the line. When we get to 0.423λ, we stop, draw a line out from the center, and where it intercepts the circle, we read off
ZL
Z0
from the grid lines on the Smith Chart. We find that
Zin
Z0
=0.30.5
(5)
Figure 2
Using a Smith Chart to Convert From Admittance to Impedance
Using a Smith Chart to Convert From Admittance to 	Impedance (803.png)
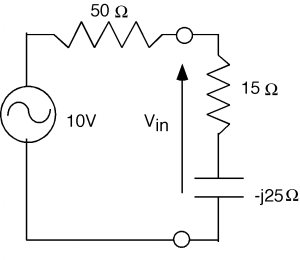
Thus, Zin=1525 ohms Figure 3. Or, the impedance at the input to the line looks like a 15Ω resistor in series with a capacitor whose reactance X=-25, or, since Xcap=
1
ωC
, we find that,
C =
1
2π200×200×106
= 31.8pF
(6)
To find Vin, there is no avoiding doing some complex math:
Vin=
1525
50+1525
10
(7)
Which, we write in polar notation, divide, figure the voltage and then return to rectangular notation.
Vin=
29.159
69.6-21
10
(8)
Vin = 0.418-38×10
= 4.18-38
= 3.302.58
(9)
Figure 3
Find Vin
Find Vin (805.png)
If at this point we needed to find the actual voltage phasor V+ we would have to use the equation
Vin = V+βL+ΓV+(βL)
= V+βL+|Γ|V+(θrβL)
(10)
Where β=
2π
λ
is the propagation constant for the line as mentioned in the last chapter, and L is the length of the line.

For this example, βL=

2π
λ
0.215λ=1.35radians and θΓ=Γ=0.52radians. Thus we have:
Vin=V+1.35+0.52V+(0.521.35) (11)
Which then gives us:
V+=
Vin
1.35+0.52(0.521.35)
(12)
When you expand the exponentials, add and combine in rectangular coordinates, change to polar, and divide, you will get a phasor value for V+. If you do it correctly, you will find that V+=5.04-71.59

Many times we don't care about V+itself, but are more interested in how much power is being delivered to the load. Note that power delivered to the input of the line is also the amount of power which is delivered to the load! Finding Iinis easy, it's just

Vin
Zin
. All we have to do is change Zin to polar form.
Zin = 1525
= 29.159
(13)
Iin =
Vin
Zin
=
4.1838
29.159
= 0.14421
(14)

Content actions

Give Feedback:

E-mail the module author | Rate module ( How does the rating system work?)

Rating system

Ratings

Ratings allow you to judge the quality of modules. If other users have ranked the module then its average rating is displayed below. Ratings are calculated on a scale from one star (Poor) to five stars (Excellent).

How to rate a module

Hover over the star that corresponds to the rating you wish to assign. Click on the star to add your rating. Your rating should be based on the quality of the content. You must have an account and be logged in to rate content.

(0 ratings)

Download module as:

PDF | EPUB (?)

What is an EPUB file?

EPUB is an electronic book format that can be read on a variety of mobile devices.

Downloading to a reading device

For detailed instructions on how to download this content's EPUB to your specific device, click the "(?)" link.

| More downloads ...

Add module to:

My Favorites (?)

'My Favorites' is a special kind of lens which you can use to bookmark modules and collections. 'My Favorites' can only be seen by you, and collections saved in 'My Favorites' can remember the last module you were on. You need an account to use 'My Favorites'.

| A lens I own (?)

Definition of a lens

Lenses

A lens is a custom view of the content in the repository. You can think of it as a fancy kind of list that will let you see content through the eyes of organizations and people you trust.

What is in a lens?

Lens makers point to materials (modules and collections), creating a guide that includes their own comments and descriptive tags about the content.

Who can create a lens?

Any individual member, a community, or a respected organization.

What are tags? tag icon

Tags are descriptors added by lens makers to help label content, attaching a vocabulary that is meaningful in the context of the lens.

| External bookmarks

Reuse / Edit:

Reuse or edit module (?)

Check out and edit

If you have permission to edit this content, using the "Reuse / Edit" action will allow you to check the content out into your Personal Workspace or a shared Workgroup and then make your edits.

Derive a copy

If you don't have permission to edit the content, you can still use "Reuse / Edit" to adapt the content by creating a derived copy of it and then editing and publishing the copy.