|
Ta strona została przetłumaczona automatycznie
z języka angielski. |
|
|
Wyświetl oryginalną stronę lub przytrzymaj mysz
nad tekstem, aby wyświetlić oryginalny język strony. |
|
|
Zplots is
an Excel application that allows you to plot impedance and related data
obtained from a variety of sources. Zplots Excel jest aplikacja, która
pozwala impedancyjnej działki i związanych z nimi danych uzyskanych z różnych
źródeł. You can plot on both an XY chart and a Smith chart as
well as view the data in tabular format. Możesz działki zarówno na
wykresie XY i wykresu Smitha, jak również wyświetlić dane w formie
tabelarycznej.
The XY chart can be customized with your choice of trace
lines. Na wykresie XY można dostosować swój wybór z linii śladu. Frequency
(in MHz) is always shown on the X axis. On the primary (left side) or secondary
(right side) Y axis you can plot: Częstotliwość (w MHz)
jest zawsze widoczne na osi X. Na głównym (po lewej stronie) lub wtórnym (po
prawej stronie) osi Y można działki:
- SWR - Standing Wave Ratio SWR - Stały Wave Ratio
- Rs - Resistance, series form R - Opór,
formie serii
- Xs - Reactance, series form XS - Reaktancja,
seria formie
- Zmag - Impedance magnitude Zmag - Impedancja wielkości
- Theta (deg) - Impedance angle Theta (st.) - kąta Impedancja
- Rho - Reflection coefficient magnitude Rho - Refleksja współczynnik wielkości
- RL (dB) - Return Loss, plotted as a negative number
to simulate "reverse scale" RL (dB)
- Return Loss, wykreślane jako liczby ujemne do
symulacji "odwrotnej skali"
- % Reflected Power % Reflected
Power
- Phase (deg) - Reflection coefficient angle
Faza (st.) - współczynnik refleksji kąt
- Q - Quality factor, |Xs| / Rs Q - Jakość
czynnikiem, | XS | / R
- Rp - Resistance, parallel form Rp - Opór, formie równoległych
- Xp - Reactance, parallel form Xp - Reaktancja, równolegle formie
- Ls (µH) - Equivalent inductance for series
Xs, both positive and negative Ls (μH) - Odpowiednik Indukcyjność dla serii XS,
zarówno pozytywnych jak i negatywnych
- Cs (pF) - Equivalent capacitance for series Xs,
both positive and negative Cs (PF) - Odpowiednik pojemność do serii
XS, zarówno pozytywnych jak i negatywnych
- Lp (µH) - Equivalent inductance for parallel
Xp, both positive and negative Lp (μH) - Odpowiednik Indukcyjność równolegle do XP,
zarówno pozytywnych jak i negatywnych
- Cp (pF) - Equivalent capacitance for parallel Xp,
both positive and negative Cp (PF) -
Odpowiednik pojemność równolegle do XP, zarówno pozytywnych jak i
negatywnych
Negative values for Ls, Cs, Lp, and Cp may be
interpreted to mean the amount of inductance or capacitance which must be
added, in series or parallel respectively, to "cancel out" the
corresponding reactance. Ujemne wartości Ls,
Cs, Lp, Cp i nie może być
interpretowane oznacza kwotę indukcyjność lub pojemność, które muszą być
dodane, równolegle lub szeregowo, odpowiednio, do "zniesienia"
odpowiednie reaktancja.
The order of the items in the above list has no special
significance other than that the items most likely to be chosen for plotting
are near the top. On the secondary (right side) Y axis you can also choose
"(none)" to indicate no secondary plot line. Kolejność pozycji
w powyższej liście nie ma specjalnego znaczenia, inne niż elementy, które
najprawdopodobniej zostaną wybrane do wykreślania są u góry. Na rynku wtórnym
(po prawej stronie) osi Y można również wybrać "(none)",
aby wskazać średniego wiersz nie fabuła.
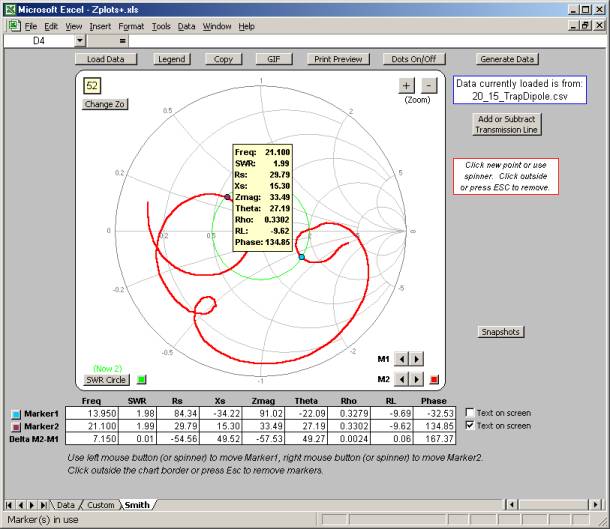
A Mini-Smith chart is shown on the same sheet with the
XY chart. Mini-Smith wykres jest pokazany na tym samym arkuszu z wykresu
XY. To see both the XY chart and the Mini-Smith at the same
time you must have your screen resolution set to 1024x768 or higher and you
must maximize both the Excel window and the workbook sub-window (using the
lower set of size buttons). Aby zobaczyć, jak wykres XY i Mini-Smith w
tym samym czasie, musisz mieć rozdzielczość ekranu ustawiona na 1024x768 lub
wyższej i należy zmaksymalizować okno programu Excel, jak i skoroszyt sub-window (z wykorzystaniem niższej zestaw przycisków
rozmiar). Alternatively, on the Excel menu you can select View |
Zoom and choose a magnification level less than 100%. Alternatywnie, w
programie Excel można wybrać menu Widok | Powiększenie i wybierz powiększenie
poziomie mniejszym niż 100%.
Zplots can read impedance data from: Zplots może odczytać danych z Impedancja:
- AIM - Antenna Analyzer AIM430 / AIM4160 /
AIM4170 by W5BIG (more info) AIM - Antenna
Analyzer AIM430 / AIM4160 / AIM4170 przez W5BIG (więcej info)
On the AIM menu bar select
File | Save Graph. Na AIM paska menu wybierz Plik | Zapisz wykres.
The current scan will be saved in two formats.
Bieżącego skanowania zostaną zapisane w dwóch formatach. The
*.scn file is used by AIM if you want to reload the scan data at a future time.
W *. scn plik jest używany
przez AIM jeśli chcesz odświeżyć skanowania danych w przyszłości. AIM
also saves the scan data in *.csv format that can be read by Zplots .
AIM również zapisuje skanowania danych w formacie *. csv, który może być odczytany przez Zplots.
Your AIM software must be
version 547 or later. Twój AIM oprogramowania
musi być w wersji 547 lub nowszej.
- VNA4Win - Windows software for the N2PK VNA
by GM4PMK and GM3SEK (more info) VNA4Win - oprogramowanie dla
systemu Windows N2PK VNA przez GM4PMK i GM3SEK (więcej info)
After at least one sweep
has been completed, the Save Data button will appear when the sweep is stopped.
Po co najmniej jednym sweep został ukończony,
przycisk Zapisz dane pojawią się, gdy został zatrzymany wymiatać. Clicking
Save Data opens a dialog box to allow you to save the measurement results as a
*.csv file. Zplots can read this file. Kliknięcie przycisku
Zapisz danych otwiera się okno dialogowe do umożliwiające zapisywanie wyników
pomiarów jako *. csv. Zplots może odczytać ten plik.
- Exeter - VNA Control Software by W8WWV (more info) Exeter
- VNA Control Software W8WWV (więcej info)
An Exeter data set is
created whenever a data capture finishes without error. Exeter jest zbiór danych jest tworzony za każdym razem, gdy
danych zakończy się bez błędów. You may then use the Save
As button (or File | Save Data Set As on the menu bar) to save the data in
*.csv format. Zplots can read this file. Note that Zplots makes
use of only the default fields in the file. Możesz następnie użyć
przycisku Zapisz jako (lub File | Save As Data Set na
pasku menu), aby zapisać dane w formacie *. csv. Zplots może
odczytać ten plik. Zplots Zauważ, że korzysta
tylko z domyślną pola w pliku . The
file may contain other fields as
well; these are ignored by Zplots . Plik może zawierać również
inne dziedziny; te są ignorowane przez Zplots.
- Refl.exe/Trans.exe/GrpDel.exe - DOS store
data programs by N2PK (more info) Refl.exe
/ Trans.exe / GrpDel.exe
- DOS przechowywania danych przez programy N2PK (więcej info)
These programs can create
various .DAT files and Zplots can read these files. Programy te
mogą tworzyć różne. Plików DAT i Zplots może
odczytać te pliki. If the file contains
multiple DUT data sets you will be asked which one you wish to show.
Jeśli plik zawiera wiele DUT zbiorów danych, użytkownik zostanie zapytany,
które z nich chcesz pokazać. Note that it is not
necessary to change the file extension to something other than .DAT, although
you may do so for other reasons. Należy pamiętać, że nie jest konieczne,
aby zmienić rozszerzenie pliku na inną niż. DAT, chociaż może to zrobić dla
innych powodów.
- VNA1/miniVNA - Antenna Analyzer and miniVNA
by IW3HEV, et al. (more info) VNA1/miniVNA - Antenna
Analyzer i miniVNA
przez IW3HEV, et al. (Więcej)
These programs can save
sweep data in *.csv format via File | Save As on the menu bar. Zplots
can read these files. Programy te można zapisać sweep
danych w formacie *. csv za
pomocą Plik | Zapisz jako na pasku menu. Zplots
może odczytać te pliki.
VNA1 software must be
version 1.1.8 or later, miniVNA software must be version 2.2.8 or later.
VNA1 oprogramowania musi być w wersji 1.1.8 lub
nowszej, miniVNA oprogramowania musi być w wersji
2.2.8 lub nowszej.
- TAPR
VNA - TAPR Vector Network Analyzer (more
info) TAPR VNA - TAPR Vector Network
Analyzer (więcej info)
Use File | Export on the
TAPR software menu bar and then choose Rectangular or Polar format (but not
csv format). Zplots can read these files and will ask if you want to use
the S11 (reflection) or S21 (transmission) data. Użyj Plik | Eksportuj w
TAPR oprogramowanie pasek menu, a następnie wybrać format prostokątny lub Polar (ale nie w formacie CSV). Zplots
może odczytać te pliki i zapyta, czy chcesz korzystać z S11 (refleksji) lub S21
(przekazanie) danych.
- EZNEC - EZNEC Antenna Software by W7EL (more info) EZNEC - EZNEC Antena
Software W7EL (więcej info)
Every time you run either
an SWR sweep using the SWR button, or a Frequency Sweep via Setups | Frequency
Sweep on the menu bar, EZNEC will automatically write a file named LastZ.txt to
the EZNEC home folder, typically
Because EZNEC overwrites
this file every time a sweep is done you may have decided to make a copy under
a different name. Ponieważ EZNEC nadpisuje ten plik za każdym razem, gdy
jest dokonywane sweep może być postanowił wykonać
kopię pod inną nazwą. You may also have changed
the file extension from .txt to .csv to allow more convenient use with a
spreadsheet program. Zplots can read the file no matter what name or
extension it may have. Można również uległy zmianie pliku z
rozszerzeniem. Txt do. Csv,
aby umożliwić bardziej wygodne wykorzystanie arkusza kalkulacyjnego w
programie. Zplots można odczytać pliku bez
względu na nazwę lub rozszerzenie może mieć.
- Antenna Model - Software for the Analysis of
Wire Antennas by Teri Software (more info) Model
anteny - Oprogramowanie do analizy Wire
Anteny przez Teri Software (więcej info)
After you have done a scan
via Calculate | Frequency Scan on the menu bar you will have the option to save
the impedance data (and other data) for the model. Po zrobić za pomocą
skanowania Oblicz | Częstotliwość skanowania na pasku menu będziesz miał
możliwość zapisania danych impedancji (i innych danych) dla modelu.
On the menu bar choose File | Export Impedance Data
Points, or press Ctrl-M. Na pasku menu wybierz Plik | Eksportuj Impedancja
punkty danych, lub naciśnij Ctrl-M. A
file named
Your Antenna Model software
must be version 635 or later. Antena modelu
oprogramowania musi być w wersji 635 lub nowszej.
The VNA4Win, Exeter, N2PK DOS, and miniVNA programs mentioned above can
create "Transmission" and/or "Group Delay" type files as
well as "Reflection" files. Zplots can read these files and
show an XY plot for: W VNA4Win, Exeter, N2PK DOS, a miniVNA
programy wymienione powyżej mogą tworzyć "Przekazanie" i / lub
"Grupa Delay" typ plików, jak i "Reflection" pliki. Zplots
może odczytać te pliki i pokazać XY działkę:
- |TL| - Transmission loss (also called insertion
loss) expressed as a ratio | TL | - Przekazanie strat (zwany także wtrąceniowej) wyrażone jako stosunek
- TL (dB) - Transmission loss in dB, plotted as a
negative number to simulate "reverse scale" TL (dB) - Przekazanie straty w dB,
wykreślane jako liczby ujemne do symulacji "odwrotnej skali"
- Phase (deg) or Grp Delay (µsec) - Phase shift
or Group delay, depending on file contents Faza (stopni) lub GRP Delay (μsec) - fazowym
lub grupy zwłoki, w zależności od zawartości pliku
When a "Transmission" or "Group
Delay" type file is used as input to Zplots the Smith charts and
certain other program functions will be disabled. Kiedy
"Przekazanie" lub "Grupa Delay"
typ plików używany jest jako wkład do Zplots
Smith z wykresów i niektóre inne funkcje programu zostaną wyłączone.
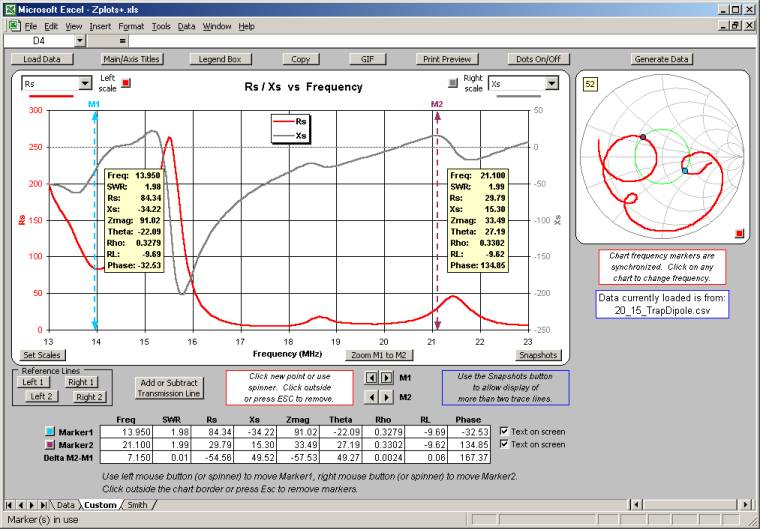
Zplots shows a large Smith chart on a separate
sheet, as pictured in the above screen shot. Zplots
pokazuje duży wykres Smitha na oddzielnej kartce, tak jak w powyższym zrzucie ekranowym. Note that the marker line / marker dot frequency markers are synchronized
on all three charts. Należy pamiętać, że w wierszu marker / znacznika dot częstotliwości markery są zsynchronizowane na wszystkie
trzy wykresy.
Buttons available on
the various sheets are: Przyciski
dostępne na różnych arkuszy są:
Load Data: Read a data file from one of the
above-mentioned sources. LOAD DATA: Odczyt danych z jednego z
wyżej wymienionych źródeł.
Note: You do not
use File | Open on the Excel menu bar to read a data file. Uwaga:
Nie używać Plik | Otwórz w programie Excel pasek menu, aby odczytać plik
z danymi. You would only use File | Open if you wanted Excel to
open a different spreadsheet program (also known as a different workbook), such
as one you might have created to track the family budget. Będziemy
używać tylko Plik | Otwórz, jeśli chcesz Excel, aby otworzyć inny program do
arkuszy kalkulacyjnych (znany również jako inny skoroszyt), takiego jak
użytkownik może tworzyć w celu śledzenia budżetów rodzinnych. Although
Zplots has the "look and feel" of a normal application program
it is important to remember that it is merely a very refined spreadsheet.
Chociaż Zplots ma "wygląd" z
normalnego stosowania programu ważne jest, aby pamiętać, że jest to jedynie
bardzo wyrafinowane arkusza kalkulacyjnego. The
operation of Zplots is controlled by the buttons on the various sheets,
not by the Excel menu bar. Funkcjonowania Zplots
jest kontrolowana przez przyciski na różnych arkuszy, a nie przez program Excel
pasek menu.
If you do use File | Open to read a data file,
Excel will open that file in a separate workbook window. Jeśli
użyć Plik | Otwórz, aby odczytać plik z danymi, Excel zostanie otwarty ten plik
w osobnym oknie skoroszytu. Excel can have multiple
workbooks open at one time, such as one for your family budget and another to
track your investments. Excel może mieć wiele otwartych skoroszytów
jednocześnie, np. jeden dla budżetu Twojej rodziny i
inną do śledzenia inwestycji. This can be confusing to
new users of Excel because typically one workbook window completely hides any
others. Zplots is still there, except it is "underneath" the
data file window you just opened. Może to być mylące dla nowych
użytkowników programu Excel, ponieważ zazwyczaj jednego skoroszytu okna
całkowicie ukrywa wszelkie inne. Zplots jest
nadal istnieje, za wyjątkiem jest "pod" plik danych, po prostu
otwarte okno. Just switch back to the Zplots window, using the
Excel menu bar 'Window' selection (just to the left of 'Help') or by pressing
Ctrl-Tab, and Zplots will ask you if you want to load the data from the
"other" window. Wystarczy przejść do okna Zplots,
Excel, korzystając z menu "Okno" wyboru (tylko po lewej stronie
"Pomoc") lub przez naciśnięcie klawiszy Ctrl
+ Tab, a Zplots
zapyta, czy chcesz załadować dane z "innych "Okna.
As an additional reminder, anytime Zplots is
active you will see a new first entry in the list of choices under the Excel
File menu. Jako dodatkowe Przypominamy, że w każdej chwili Zplots jest aktywnych pojawi się nowy wpis pierwszy
na liście wyboru w menu Plik programu Excel. The
new choice is
Generate Data: Use this button to create and then automatically load a
frequency sweep data file independent of any other program. Generowania
danych: Za pomocą tego przycisku, aby utworzyć, a następnie automatycznie
ładować częstotliwości sweep pliku danych niezależny
od jakiegokolwiek innego programu. (More details below.)
(Więcej informacji poniżej).
Change Zo: Some data sources include the
reference Zo value that was used to compute Rho (and hence SWR, Return Loss, %
Reflected Power, and Phase). Zmień ZO: Niektóre źródła danych
zawierają odniesienie ZO wartość, która była wykorzystana do obliczania Rho (SWR, a co za tym idzie, Return Loss,%
Reflected Power, a faza). Others
do not, in which case Zo will default to 50. Inni nie, w którym to
przypadku ZO domyślnie będzie do 50. You can use this button to
change Zo at any time. Możesz użyć tego przycisku, aby zmienić ZO w
dowolnym momencie. You may also click directly
on the text box in the upper left corner of either Smith chart to change Zo.
Możesz również kliknąć bezpośrednio na pole tekstowe w lewym górnym rogu wykresu
Smitha albo zmienić ZO. You may find this
convenient when viewing the Mini-Smith. Możesz znaleźć tego wygodne
podczas oglądania Mini-Smith.
Main/Axis Titles: (Custom XY chart only) Change
the text shown for the main chart title, the X axis title (normally
"Frequency"), the primary (left side) Y axis title, and the secondary
(right side) Y axis title. Strona główna / Oś tytułów: (Custom wykresie XY tylko) Zmiany tekstu pokazane na głównym
wykresie tytuł, tytuł osi X (zwykle "Pasmo"), podstawowym (po lewej
stronie) Nazwa osi Y, a drugiego (po prawej stronie) Y Nazwa osi.
Legend Box: Add or delete the legend box and
change the text shown in the box. Legenda Box:
Dodaj lub usuń legendy pola i zmienić tekst znajdujący się w polu. You
can move the position of the legend box by dragging with the mouse.
Możesz zmienić pozycję legendy z pola, przeciągając je myszą. When
you are done click anywhere outside the chart. Po zakończeniu kliknij
gdziekolwiek poza wykres.
Copy: Copy the chart (main chart only on the
Custom sheet) to the clipboard, with optional resizing. Kopiuj:
Kopiowanie wykresu (wykres głównych tylko na niestandardowych arkuszy) do
schowka, z możliwością zmiany rozmiaru. The chart can then be
pasted into another application such as Word or Paint. Wykresu można
następnie wklejony do innej stosowania takich jak Word lub Paint.
GIF: Create a GIF file of the chart (main chart
only on the Custom sheet), with optional resizing. GIF: Tworzenie
pliku GIF na wykresie (wykres głównych tylko na niestandardowych arkuszy), z
możliwością zmiany rozmiaru. The GIF file can then be
used with email and web pages. GIF plik może być następnie wykorzystane
z poczty elektronicznej i stron internetowych.
Print Preview: This shows what the chart will
look like if printed. Podgląd wydruku: To, co pokazuje wykres
będzie wyglądać, jeśli drukowane. You can of course then
print the chart, but you might also want to use this button just to see a
magnified version of the chart which may help in picking out fine details.
Można oczywiście wydrukować wykres, ale możesz również użyć tego przycisku, aby
tylko zobaczyć powiększony wersji wykresu, które mogą pomóc w zbierająca się
dobrze szczegóły.
Dots On/Off: When "On" you can see a
round dot for each data point on the chart traces. Kropek On / Off: Podczas "Dnia" można zobaczyć okrągłe
kropki dla każdego punktu danych na wykresie śladów. When
"Off" the traces are just lines. Gdy "Off"
ślady są po prostu wiersze.
Set Scales: (Custom XY chart only) The min and max
settings for the primary and secondary Y axis scales are normally set
automatically by Excel. Wagi zestaw: (niestandardowe tylko wykres
XY) min i max ustawienia dla podstawowego i średniego Y osi skale są
zazwyczaj ustawiane automatycznie przez program Excel. You
can use this button to "freeze" the min and max at values of your
choice. Możesz użyć tego przycisku, aby "zamrozić" min i max
wartości na swój wybór. You can also set the min
and max of the X axis in order to "zoom in" on a frequency
subset of interest. Można również ustawić min i max osi X w celu
"zbliżenia" na częstotliwości podzbiór zainteresowania.
Warning: The scales will
stay locked until you manually reset them. Ostrzeżenie: skale
pozostanie zablokowana do momentu aż ręcznie zresetować
im. Suppose you are plotting SWR and you set the Y axis min
to 1 because you know that the SWR value will never fall below 1.
Załóżmy jesteś wykreślania SWR i ustawić min Y Oś 1, ponieważ wiesz, że SWR
wartość nigdy nie spadnie poniżej 1. Then you decide to plot Rho.
Następnie należy zdecydować się na działkę Rho.
Since Rho values are (almost) always less than 1, the
trace line for Rho will be entirely "clipped" and will appear as just
a flat line along the bottom of the chart. Ponieważ Rho
wartości (prawie) zawsze mniej niż 1, śledzenia linii dla Rho
będzie całkowicie "oszukane" i jak tylko pojawią się płaską linię
wzdłuż dolnej części wykresu.
Zoom M1 to M2: This button offers a more
convenient way to zoom in on a frequency range of interest. Powiększ
M1 do M2: Przycisk ten oferuje wygodniejszy sposób na powiększenie w
zakresie częstotliwości od zainteresowania. Set
Marker1 with the left mouse button and Marker2 with the right mouse button.
Ustaw Marker1 z lewego przycisku myszy i Marker2 z prawego przycisku myszy.
Press "Zoom M1 to M2" and the frequency range
of the X axis will be changed to match the range between the two
markers. Naciśnij "Zoom M1 do M2" i zakresie częstotliwości od
osi X zostanie zmieniony, aby dopasować zakres między dwoma znacznikami.
When you use this button (or if you do the same thing
manually using "Set Scales"), an additional Full Freq Range
button will appear allowing you to return to showing the entire set of
frequencies available in the data file. Podczas korzystania z tego przycisku
(lub, jeśli to samo zrobić ręcznie za pomocą "Ustaw Wagi"), Full dodatkowej Freq
Range pojawią się przycisk pozwala na powrót do
pokazano całego zestawu częstotliwości dostępne w pliku danych.
Snapshots: This button has two uses. On the
Custom XY chart you can use snapshots to plot more than two trace lines at the
same time. Migawki: Przycisk ten ma dwie korzysta. Na wykresie XY
niestandardowej można użyć migawki do działki więcej niż dwóch śladów linii
jednocześnie. For example, you could plot Xs on the primary (left)
axis and take a snapshot. Na przykład, można działkę Xs
na podstawowym (z lewej) i osi podjąć migawkę. Then
plot Rs (again on the left axis) and take another snapshot. Następnie
fabuła R (ponownie po lewej stronie osi) i zrobić kolejne migawki. Then
plot Zmag. Następnie działki Zmag. While
you are doing this you can be showing Theta (for example) on the secondary
(right) axis. Podczas ten sposób można być wyświetlana Theta (na przykład) na rynku wtórnym (z prawej) oś. When
you are done you will have four trace lines: Zmag, Rs, and Xs using the left
scale and Theta using the right scale. Kiedy skończymy będzie śladu
cztery wiersze: Zmag, R, X i korzystając z lewej
strony skali i przy użyciu Theta prawo skali.
On both the Custom XY chart and the Smith chart you can
also use snapshots in order to compare data from one sweep against that from
another. Snapshot traces persist when you load new data. Hence you can,
for example, load data from a particular *.csv file, take a snapshot, load data
from a different file, and see how the two compare. Zarówno na wykresie
XY niestandardowe i Smith wykresu można również użyć migawki w celu porównania
danych z jednego wymiatać przeciwko, że z innego. Migawka
ślady utrzymują się podczas załadowania nowych danych. Stąd możesz, na
przykład, załadować dane z konkretnego * . csv, podejmują migawkę, załaduj dane z innego pliku,
i zobaczyć, jak dwóch porównać. If you are using one of the
N2PK VNA control software programs or the miniVNA program you could even load a
"Reflection" type file, take a snapshot, then load a
"Transmission" type file and see the S11 and S21 traces overlaid.
Jeśli używasz jednej z N2PK VNA kontroli programów lub miniVNA
programu można załadować nawet "Reflection"
typ pliku, podjąć migawki, a następnie załadować "Przekazanie" typ
pliku i zobaczyć S11 i S21 ślady pokrył.
You can also compare data from completely different
sources. Można również porównać dane z zupełnie różnych źródeł. For
example, suppose you modeled an antenna with EZNEC, constructed a
"real-world" version of the model, and took some impedance
measurements when you were done. Na przykład załóżmy, wzorowała się you anteny z EZNEC, wykonane w "prawdziwym
świecie" wersję modelu, a niektóre miały pomiary
impedancji, kiedy zostały zrobione. You could load the EZNEC
SWR sweep data (from LastZ.txt) into Zplots and take one or more
snapshots. Można załadować EZNEC SWR sweep
danych (z LastZ.txt) do Zplots
i przyjąć jedną lub więcej obrazów. Then load the data file
produced by your AIM or VNA software. Następnie załadować pliku danych
produkowanych przez AIM lub VNA oprogramowania. Now
you can see the difference, hopefully small, between the "as modeled"
as "as measured" data. Teraz możesz zobaczyć różnicę, małe nadzieję,
pomiędzy "jako wzór" jak "mierzone" danych. (See
below for more on the Zplots 'Add or Subtract Transmission Line' feature
which allows you to account for the fact that your modeled impedance [probably]
represents the antenna feed point while your measured impedance was [probably]
taken at the input end of a feedline.) (Patrz niżej więcej na Zplots "Dodaj lub Usuń Przekazanie Linia"
funkcja, która pozwala uwzględnić fakt, że wzorowany Impedancja
[prawdopodobnie] stanowi punkt, podczas gdy anteny swój paszy Impedancja
mierzona była [prawdopodobnie] podjęte na wejście końca jeden feedline.)
Reference Lines: (Custom XY chart only) Use these
buttons to add horizontal marker lines to the chart, perhaps to aid in analysis
or presentation. Linie odniesienia: (niestandardowy wykresu XY
tylko) Użyj tych przycisków, aby dodać znacznik poziomych linii na wykresie,
być może do pomocy w analizie lub prezentacji. You
can show up to two reference lines associated with the left scale and up to two
reference lines associated with the right scale. Możesz wyświetlić
maksymalnie do dwóch linii odniesienia związane z lewej strony skali i do dwóch
linii odniesienia związane z prawem skalę.
Zplots also has a fifth reference line not under
direct user control. Zplots ma również
piąty linia nie pod bezpośrednią kontrolą użytkownika. Whenever
you plot any item on the RIGHT (secondary) axis that is likely to have both
positive and negative values, such as Xs or Theta, Zplots will show a
dotted line which corresponds to zero on that axis. Za każdym razem gdy fabuła dowolnej pozycji po prawej stronie
(wtórnego) osi, które mogą mieć zarówno pozytywne jak i negatywne wartości,
takich jak Xs lub Theta, Zplots pokaże kropkowana linia, która odpowiada na
zero, że oś. This may be helpful in situations where there is not a
normal gridline at the zero value. Może to być pomocne w sytuacjach,
gdzie nie ma normalnych linii siatki na zero. Note
that when plotting items on the LEFT (primary) scale it is usually possible to
set the scale min and max values such that a gridline will show at the zero
value, hence there is no need for a "program-controlled" zero line
for the LEFT axis. Należy pamiętać, że podczas wykreślania pozycji na
lewym (podstawowe) Skala jest zazwyczaj możliwe w skali min i max wartości
takie, że na linii siatki będą wyświetlane wartości zerowej, więc nie ma
potrzeby na "program kontrolowanych" zero dla linii W LEWO osi.
Zoom In/Out: (Smith chart only) In some but not
all cases it is useful to be able to zoom in on the center portion of the Smith
chart. Zoom in / out: (Smith tylko wykres) W niektórych, ale nie we
wszystkich przypadkach jest to użyteczne, aby móc w sprawie powiększenia
centrum części wykresu Smitha. The zoom steps correspond
to: Full size > SWR 5:1 > SWR 3:1 > SWR 2:1, with some overshoot in
the corners at anything other than full size. Powiększenia kroki
odpowiadają: Pełny rozmiar> SWR 5:1> SWR 3:1> SWR 2:1, z pewnymi
przekroczenia w narożnikach na cokolwiek innego niż w pełnym rozmiarze. When
you zoom the main Smith the Mini-Smith will follow. Podczas powiększania
głównego Smith Mini-Smith będzie śledził.
SWR Circle: (Smith chart only) You can choose to
show a constant SWR circle at a specified size, hide (not show) the circle, or
have the circle auto-size to match the frequency marker. SWR Circle: (Smith tylko wykres) można wyświetlać stały SWR
okręgu w określonym rozmiarze, ukryć (nie pokazywać) okręgu, koła lub mają
automatyczne dopasowanie rozmiaru do częstotliwości markera. (More
on frequency markers below.) (Więcej na temat markerów częstotliwości
poniżej).
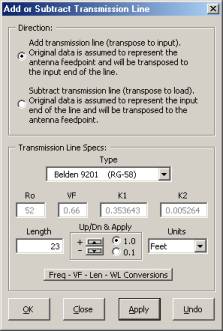
Add or Subtract Transmission Line: For modeled
data you may wish to "Add" a transmission line to the results to see
what the impedance or SWR would be at the transmitter (or tuner) end of the
line. Zplots lets you do that without making any changes to the model
itself, such as adding a NEC TL card and an extra wire. Dodać lub
odjąć Przekazanie Line: Dla wzorowany
danych można "Dodaj" linię przesyłową na wyniki, aby zobaczyć co impedancji lub liny stalowe będą na nadajnik
(lub tunera) końca lini. Zplots
pozwala to zrobić bez tworzenia żadnych zmian do samego modelu, takie jak dodanie NEC TL karty i dodatkowy drut. On
the other hand, for measured data you may wish to transpose the
measurements to the antenna feedpoint. Z drugiej strony, dla zmierzonych
danych można transponować do pomiarów anteny feedpoint.
In that case you can "Subtract" a transmission
line. W takim przypadku można "Odejmij" linię przesyłową.
Either way, you can choose from several dozen line types
or you can specify your own line characteristics such as Ro and VF.
Każdym sposobem, możesz wybierać z kilkudziesięciu rodzajów linii można też
określić swoje własne cechy, takie jak linia ro i VF.
Line loss is included in the calculations. Linia
straty są uwzględnione w obliczeniach. You can 'Apply' the
transformation without closing the dialog box, perhaps to see the results as
you are viewing one of the charts. Można "Zastosuj"
transformacji bez zamykania okna dialogowego, być może, aby zobaczyć wyniki
podczas oglądania jednego z wykresów. It may be helpful, although
not required, for you to take a snapshot of the original trace before doing the
transformation. Może to być przydatne, choć nie jest wymagane, aby podjąć
migawkę oryginalnego śladu przed robisz transformacji. This
will allow you to visually compare the "before" and "after"
impedance values. Dzięki niemu będziecie mogli wzrokowej porównanie
"przed" i "po" wartości impedancji.
Important: The "start point" for the impedance
transformation will ALWAYS be the impedance as contained in the source data
file that is currently loaded into Zplots . Ważne: "punkt
początkowy" do transformacji impedancji będą zawsze impedancyjnego jako
źródło zawartych w pliku danych, który jest aktualnie załadowany do Zplots. So,
for example, if you "Add" a transmission line of length 50 feet and
then "Add" 55 feet, the length of the simulated line will be 55 feet,
not 105 feet. Similarly, if you "Add" 100 feet and then
"Subtract" 100 feet you will not be back to where you started,
you will see the results of subtracting 100 feet. Tak, na przykład,
jeśli "Dodaj" linię przesyłową o długości
For users familiar with AIM, the "Subtract
Transmission Line" feature is conceptually identical to the AIM
"Refer to Antenna" feature. Dla użytkowników znać cel,
"Odejmij Przekazanie Linia" funkcja jest koncepcyjnie identyczne z
celem "odnoszą się do anteny" funkcji. Using
AIM to do the transformation will be more accurate since AIM accounts for the
small changes in line Ro and VF as the frequency changes. Korzystanie z
AIM do przekształcenia będą bardziej precyzyjne, ponieważ AIM kont dla małych
zmian w linii Ro VF, jak i częstotliwości zmian.
Remember, you must first use AIM to calibrate the line
in question and that requires access to the far end so you can terminate the
line with two different resistors. Pamiętaj, musisz najpierw użyć AIM do
linii kalibracji, o których mowa, oraz że wymaga dostępu do końca tak daleko
można zakończyć zgodnie z dwóch różnych rezystorów. But
if you have an AIM device and you can access the far end of the line you should
definitely use the "Refer to Antenna" feature. Ale jeśli masz
konta AIM i urządzenia można daleki dostępu końca linii powinno się używać
"odnoszą się do anteny" funkcji.
For users familiar with Exeter, "Subtract
Transmission Line" is conceptually identical to the Exeter "Feed
System" feature. Dla użytkowników zaznajomieni z Exeter, "Odejmij Przekazanie Linia" koncepcyjnie
jest identyczny z Exeter "Feed
System" funkcji. And of course when using
the N2PK VNA with any software you can always do an
Example of using the
"Add Transmission Line" feature: Przykład za pomocą "Dodaj Przekazanie Linia"
funkcja:
|
|
|
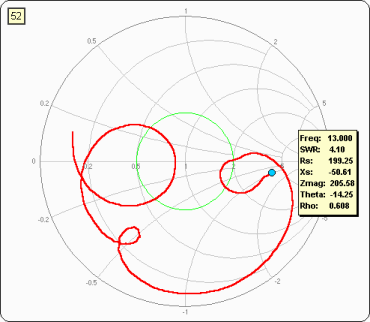
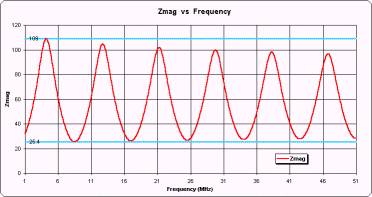
Here are the results of
a frequency scan from 13 to 23 MHz on an indoor 20M/15M trap dipole, tacked
up to the ceiling about 8 feet off the ground. Oto wyniki skanowania częstotliwości od 13 MHz do 23 w pomieszczeniach 20M/15M pułapkę dipola, dołączona do pułapu około The frequency progression follows a clockwise path on
the trace. Częstotliwość progresji następuje zgodnie z ruchem
wskazówek zegara na ścieżce śladu. The blue dot marker and
the associated text box show the 13 MHz scan point. Niebieska Kropka
markera i związane z pola tekstowego pokaż 13 MHz
skanowania pkt. (This is the same Smith chart as is shown in the above
screen shot, except this image was made using the GIF button with
optional resizing. Notice that when you use the Copy or GIF
buttons only the chart itself is captured, not including all the various
control buttons that are normally shown.) (Jest to ten sam wykres
Smitha, jak jest to pokazane na powyższym zrzucie ekranowym, z wyjątkiem tego
obrazu została dokonana przy użyciu przycisku GIF z opcjonalnego
rozmiaru. Zauważ, że podczas korzystania z przycisków Kopiuj lub GIF
tylko sam wykres jest opanowana, nie wliczając wszystkie różne przyciski,
które są normalnie widoczne.) |
|
|
|
Here are the results of
an EZNEC SWR sweep for a model of a 20M/15M trap dipole over
the same frequency range. Oto
wyniki z EZNEC SWR sweep dla modelu
o 20M/15M pułapkę dipola w tym samym paśmie
częstotliwości. The data is from the EZNEC LastZ.txt file and represents the
impedance as seen at the feedpoint of the antenna. Dane są z EZNEC LastZ.txt
pliku i reprezentuje impedancji jak pokazano na feedpoint
z anteny. As you can see, it is not very obvious that these two
Smith chart traces have anything to do with each other. Jak widać, nie
jest to bardzo oczywiste, że te dwa Smith wykres ślady mają nic wspólnego ze sobą. |
|
|
|
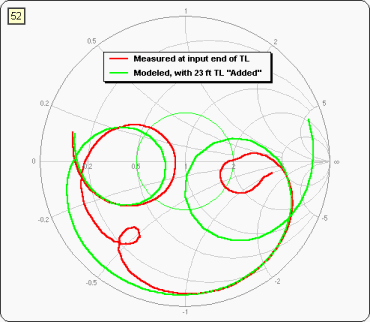
Finally, here is the
original measurement data (red) compared with the modeled
data (green), except that a 23 foot length of RG-58 has been
"Added" to the modeled results. Ostatecznie, tu jest oryginał danych
pomiarowych (czerwony) w porównaniu z wzorowany danych
(zielone), chyba że The traces match fairly well at the higher frequencies
of the 15M band. Ślady dość dobrze pasuje na wyższe częstotliwości w
paśmie 15M. For the lower frequency 20M band it is obvious that
the model has some shortcomings, perhaps related to all the interactions with
house wiring and roof gutters. Dla niższych częstotliwości pasma 20M
jest oczywiste, że model ma pewne braki, być może
związane z wszystkich interakcji z domu okablowania rynien i dachów. (Or perhaps I just didn't do a very good job of
creating the model!) But at least now it is apparent that there is some kind
of correlation between the measured and modeled data. (A może ja po
prostu nie zrobić bardzo dobrą pracę tworzenia modelu!)
Ale przynajmniej teraz jest oczywiste, że istnieje pewien rodzaj korelacji
pomiędzy mierzoną i modelowanie danych. |
|
|
|
This is the dialog
(reduced-size image) that controls transmission lines. To okno dialogowe (zmniejszonej wielkości obrazu),
który kontroluje linie przesyłowe. Choose Add or Subtract,
select a line type, enter a length and select the length units.
Wybierz Dodaj lub Usuń, wybrać typ linii,
wprowadzić długość i wybrać długość jednostki. If you click 'OK' the
transformation will be applied and the dialog window will close.
Po kliknięciu przycisku "OK"
transformacji będą stosowane i zamknij okno dialogowe. If you click 'Apply'
the dialog window will stay open after the calculations are complete.
Jeśli klikniesz przycisk "Zastosuj"
okienko dialogowe pozostanie otwarte po obliczeń są kompletne. 'Undo' is used to
remove any previous-applied transformations. "Undo" jest
używany w celu usunięcia wszelkich poprzednich stosowane w przemianach.
The spin button changes the length of the line by +/-
1 or +/- 0.1 (in the current units) and then does an 'Apply' operation.
Przycisk obracania zmiany długości linii o + / - 1 lub + / - 0,1 (w bieżących
jednostek), a następnie nie na "Zastosuj" operacji. Hence the spinner may be used to make adjustments
interactively while you watch the results change on the charts. Stąd
tarczy mogą być wykorzystywane w celu dokonania dostosowań interaktywnie
podczas obejrzeć wyniki zmian na wykresach. To use custom values for the transmission line
parameters select the last entry in the 'Type' drop down box. Aby
używać niestandardowych wartości dla parametrów linii przesyłowych wybrać
ostatni wpis w kolumnie "Typ" listy rozwijanej. Doing so will allow you to set the Ro, VF, K1, and K2
boxes. Tym samym pozwoli Ci ustawić RO, VF, K1, K2 i pola. (If you are not familiar with K1 and K2 just leave the
values the same as for a similar line type.) (Jeśli
nie są zaznajomieni z K1 i K2 po prostu pozostawić wartości takie same jak
dla podobnego typu linii.) |
|
|
|
Anytime a
transformation has been applied a small reminder will appear underneath the
"Add or Subtract" button. Anytime
transformacji została zastosowana niewielka przypomnienia będą wyświetlane
pod "Dodaj lub Usuń" button.
|

|
|
|
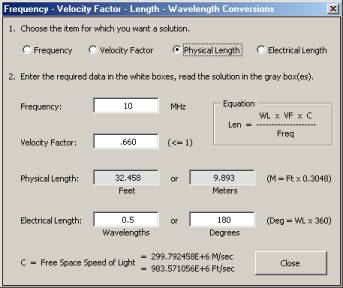
This is a sub-dialog of
"Add or Subtract" that you may find useful to help in determining
particular line lengths to use. Jest
to sub-dialog z "Dodaj lub Usuń", które
mogą okazać się przydatne, aby pomóc w określaniu długości szczególności
linii do użytku. It is basically a calculator for the velocity factor equation in
different forms. Jest to w
zasadzie kalkulator do prędkości czynnika równania w różnych formach.
Choose which item you
want to solve for and the results will be computed automatically as you
change the input fields. Wybierz
element, który chcesz rozwiązać i wyniki będą obliczane automatycznie po
zmianie pola. You can also use this calculator to determine physical
line lengths from measurements. Możesz również skorzystać z tej
fizycznej calculator do określenia długości linii z
pomiarów. Terminate the line with either an open or short and
run a frequency sweep with your analyzer. Kończy wiersz albo otwartego
lub krótkiego i uruchomienie częstotliwości sweep z
analizatora. Display the results with Zplots , select Zmag
(impedance magnitude) as the parameter to be plotted, place Marker1 on one
Zmag peak and Marker2 on the next peak. Wyświetlić wyniki z Zplots, wybierz Zmag
(wielkość impedancji) jako parametr być narysowane, miejsce Marker1 na jednym
Zmag szczytowego i Marker2 na następny szczyt.
The frequency difference between the two, available in
the lower row of the marker value table, is the half wavelength frequency for
the line. Częstotliwości różnica między tymi dwoma, dostępne w dolnym
wierszu tabeli wartości znacznika, to połowa długości fali częstotliwości dla
linii. Enter that frequency in the calculator, set the
velocity factor to match the line in question, make sure the electrical
length is a half wavelength, and read the physical length in feet or meters.
Wprowadź częstotliwość, że w kalkulator, ustawić prędkość czynnikiem
wpływającym na linii w meczu pytanie, upewnij się, że elektryczne jest pół
długości fali, i przeczytać fizycznej długość w stopach lub metrach. |
Example of using the
"Generate Data" feature: Przykład za pomocą "Generowanie danych" funkcja:
|
|
|
This is the dialog
(reduced-size image) that controls the generation of frequency sweep data
internal to Zplots . To
okno dialogowe (zmniejszonej wielkości obrazu), który kontroluje wytwarzanie
częstotliwości sweep danych do wewnętrznych Zplots. Specify the desired
start, stop, and step values for frequency. Określ żądane start, stop, krok wartości i
częstotliwości. The Number of Points box will be recalculated automatically as
you are making changes to the frequency range or step size. Liczba
punktów pole zostanie ponownie obliczona automatycznie podczas dokonywania
zmian w zakresie częstotliwości lub wielkości kroku. The Number of Points box is read-only, but if
you don't care about the frequency step size in MHz you can specify the
number of points to be generated by putting a 'p' after the number in the
"Step" box. Liczba punktów pole jest tylko do
odczytu, ale jeśli nie troszczysz się o częstotliwości w MHz
Wielkość kroku możesz określić liczbę punktów, które mają być generowane
przez umieszczenie "p" po numerze w "Krok" polu. That is, if you want 100 data points enter
"100p" (no quotes) in the box. To znaczy, jeśli chcesz
wpisać 100 punktów danych "100p" (bez cudzysłowu) w polu. Note that using the 'p' option may result in some very
odd frequency steps between the Start and Stop frequencies. Należy
pamiętać, że korzystając z "p" opcja może spowodować bardzo
nieparzyste częstotliwość kroków między start i stop częstotliwości. For the type of data to generate you can choose a
simple R and X combination (which will not vary as the frequency changes), a
series combination of R and L, a parallel combination of R and C, |
Zplots will create a file named
'$Zplots$Generated.csv' in the same folder that contains the Zplots.xls
workbook. Zplots stworzy plik o nazwie
"$ Zplots $ Generated.csv" w tym samym folderze, który zawiera Zplots.xls skoroszytu. This file is then
automatically loaded. Plik ten jest następnie automatycznie ładowane.
The file is not erased when the operation is
complete. Plik nie zostanie usunięte, gdy operacja jest
zakończona. You are free to modify the contents of this file if you
wish, perhaps cutting and pasting from another application. Można
dowolnie modyfikować zawartość tego pliku, jeśli chcesz, być może cięcia i
wklejania z innej stosowania. (Don't change the first two
lines. And note that the file contains columns for only Frequency in MHz,
series form R, and series form X no matter what type of data was specified in
the dialog window.) You can then load the modified data into Zplots just
like any other data file. (Nie należy zmienić dwie pierwsze linie. A
pamiętać, że plik zawiera tylko kolumny Częstotliwość w MHz,
seria R formie i postaci serii X bez względu na typ danych został określony w
oknie dialogowym.) Można następnie załadować zmodyfikowanych danych do Zplots podobnie jak wszelkie inne dane pliku.
The file name will be reused the next time you use the
"Generate Data" feature, so if you modify the contents you may wish
to also rename the file. Nazwa pliku zostaną ponownie wykorzystane przy
następnym korzystaniu z "Generowanie danych funkcji, więc jeśli
modyfikować zawartość można również zmienić nazwę pliku.
|
|
|
This shows what the
above |
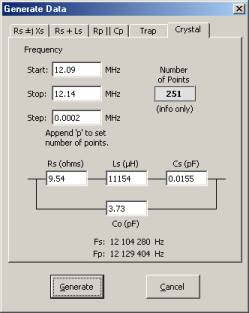
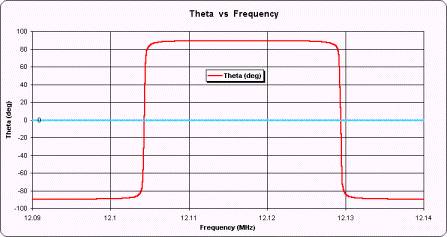
Below is another example of using the "Generate
Data" feature, this time for a quartz crystal. Poniżej inny
przykład za pomocą "Generowanie danych funkcji, tym razem na kwarcowych.
The parameter values are shown in the dialog box on the
left. Wartości parametrów są wyświetlane w oknie po lewej stronie.
Note that when you model a crystal Zplots will
automatically calculate the series and parallel resonant frequencies as you
change the values for Ls, Cs, and Co. Należy pamiętać, że po modelu krystalicznie Zplots
automatycznie obliczy serii i częstotliwości rezonansowe równolegle podczas
zmiany wartości Ls, CS, oraz Co
The results of the simulation are shown on the right.
Wyniki symulacji są wyświetlane po prawej stronie. The
resonant frequencies are the points where Theta (impedance angle) crosses the
zero line. Na częstotliwości rezonansowe są punkty, w których Theta (kąt impedancji) przenika przez zero linii.
|
|
|
|
Getting more
information for each plotted point: Uzyskiwanie dodatkowych informacji dla każdego
wykreśla punkt:
![]() When
you hover the mouse pointer over any data point on the Custom XY chart a small
"Chart Tips" box will appear. Po hover
wskaźnik myszy nad dowolnym punktem danych na wykresie XY Custom
mały "Wykres Sztuczki" pojawi się pole wyboru. The
first line in the box will show the name of the item being plotted, such as
Zmag or Theta. Pierwsza linia w polu pokaże nazwę przedmiotu są
wykreślane, takich jak Zmag lub Theta.
(Different versions of Excel may show additional
information.) The second line will be in the form (xx,yy) where xx is the
frequency at that point and yy is the data value. (Różne wersje programu
Excel mogą być wyświetlane dodatkowe informacje.) Druga linia będzie w formie
(xx, yy), gdzie xx jest częstotliwość na tym punkcie
i rr jest wartość danych. On
the Smith chart a similar box will appear but the information shown is actually
the real and imaginary parts of Gamma (complex Rho). Na wykresie Smitha
podobnym polu pojawi się informacja, ale pokazane jest rzeczywiście realne i
wyobrażone części Gamma (Złożona Rho).
When
you hover the mouse pointer over any data point on the Custom XY chart a small
"Chart Tips" box will appear. Po hover
wskaźnik myszy nad dowolnym punktem danych na wykresie XY Custom
mały "Wykres Sztuczki" pojawi się pole wyboru. The
first line in the box will show the name of the item being plotted, such as
Zmag or Theta. Pierwsza linia w polu pokaże nazwę przedmiotu są
wykreślane, takich jak Zmag lub Theta.
(Different versions of Excel may show additional
information.) The second line will be in the form (xx,yy) where xx is the
frequency at that point and yy is the data value. (Różne wersje programu
Excel mogą być wyświetlane dodatkowe informacje.) Druga linia będzie w formie
(xx, yy), gdzie xx jest częstotliwość na tym punkcie
i rr jest wartość danych. On
the Smith chart a similar box will appear but the information shown is actually
the real and imaginary parts of Gamma (complex Rho). Na wykresie Smitha
podobnym polu pojawi się informacja, ale pokazane jest rzeczywiście realne i
wyobrażone części Gamma (Złożona Rho).
To see more information for a given point, click the
point with your mouse. Aby zobaczyć więcej informacji na dany punkt,
kliknij punkt za pomocą myszki. On the Custom XY chart a
vertical line frequency marker will appear. Na wykresie XY Custom pionowej linii częstotliwość pojawi się znacznik.
On the Smith charts the frequency marker will be a large
dot. Na Smith wykresy częstotliwości znacznik będzie duża kropka.
In both cases a large text box (optional) will show
other data values for that particular frequency. W obu przypadkach duże
pole tekstowe (opcjonalnie) pokaże inne wartości danych w odniesieniu do danej
częstotliwości. (The same information is also shown in the marker table
below the chart.) To move to a different frequency click on a new data point,
use the spinner button, or use the keyboard arrow keys. (Te same
informacje są również pokazane w poniższej tabeli znacznik wykresu.) Aby
przejść do innej częstotliwości, kliknij na nowy punkt danych, użyj tarczy
przycisku lub użyć klawiszy strzałek na klawiaturze. (Up
and Right increase the frequency, Down and Left decrease the frequency. The
keyboard arrows control Marker1 only.) All three charts are synchronized, so
when you click on a new point (or use the spinner or arrow keys) to change the
frequency marker on one chart it will be changed on the other two charts as
well. (Up Prawo i zwiększenia częstotliwości,
w dół w lewo i zmniejszyć częstotliwość. Klawiatura strzały kontroli Marker1
tylko.) Wszystkie trzy wykresy są zsynchronizowane, tak po kliknięciu na nowy
punkt (lub użyć klawiszy strzałek lub tarczy), aby zmienić częstotliwość
znacznik na jednym wykresie zostanie on zmieniony w sprawie dwóch pozostałych,
jak również wykresy. To see a second marker use
the right mouse button. Aby zobaczyć drugiego znacznika użyć prawego
przycisku myszy. To remove the frequency marker(s) and associated text
box(es) click anywhere outside the chart boundary or press the Esc key.
Aby usunąć znacznik częstotliwości (-y) i związane z pola tekstowego (y)
kliknij gdziekolwiek poza granicę wykresu lub naciśnij klawisz Esc.
For users familiar with AIM, please note that the
vertical line is not a cursor. Dla użytkowników zaznajomieni z
AIM, proszę pamiętać, że linia nie jest kursor. You
don't drag it to a new position on the chart. Nie przeciągnij go do
nowej pozycji na wykresie. Instead, use the arrow keys
or click a new point. Zamiast tego należy użyć klawiszy strzałek lub
kliknij nowy punkt. Also note that Zplots
does not do any interpolation of the data points. Zplots
również pamiętać, że nie robi jakiejkolwiek interpolacji z punktów danych.
The vertical line will move from one scanned frequency
to the next, not from one chart pixel to the next as with AIM. Linia
pionowa będzie przenieść z jednego skanowane częstotliwości do następnego, a
nie z jednego piksela na wykresie obok, jak z AIM.
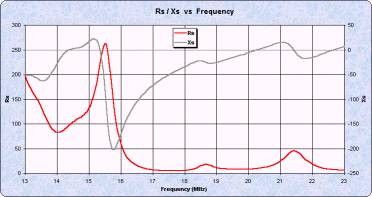
Resolving the sign of
X: Rozwiązywanie znak X:
This section applies only to users of the VNA1
and miniVNA analyzers. Ta sekcja ma zastosowanie tylko do
użytkowników z VNA1 i miniVNA analizatory. These
devices do not show the sign (positive or negative) of the reactance value X.
One method that is often cited to determine the sign of X involves noting the
change in the impedance magnitude (Zmag) between a lower frequency and a higher
frequency. Urządzenia te nie pokazują znaku (pozytywne lub negatywne) z
reaktancja wartości X. Jedną z metod, które są często cytowane w celu ustalenia
znak X obejmuje zauważając zmian w impedancyjnego wielkości (Zmag) między niższą częstotliwość i wyższe częstotliwości.
If the Z magnitude increases the sign of X is assumed to
be positive and if the Z magnitude decreases the sign of X is assumed to be
negative. Jeżeli Z wielkości podwyżek znak X zakłada się pozytywny i
jeżeli Z wielkości zmniejsza znak X jest za negatywne.
This method works for relatively simple configurations
of discrete components when connected directly to the analyzer and for simple
antennas when measured at the antenna feedpoint. Ta metoda działa w
stosunkowo prosty w konfiguracji elementów dyskretnych, gdy podłączony
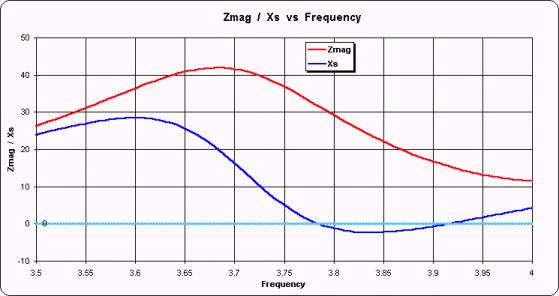
bezpośrednio do analizatora i do prostych anten, gdy mierzona na antenę feedpoint. For example, the following
figure shows the Z and X values for an 80 meter dipole antenna that is resonant
at 3.75 MHz. Na przykład, następujący rysunek pokazuje wartości Z i X do
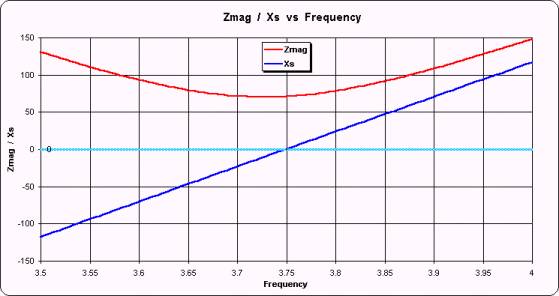
The red line is the Z magnitude and the dark blue line
is the reactance X. (The light blue horizontal line merely highlights 0 on the
scale.) As can be seen, above 3.75 MHz where the Z magnitude is increasing the
sign of X is positive and below 3.75 MHz where the Z magnitude is decreasing
the sign of X is negative. Czerwonej linii jest Z wielkości i
ciemnoniebieska linia jest reaktancja X. (Światło niebieskie poziome linie
jedynie podkreśla 0 w skali.) Jak widać powyżej 3,75 MHz,
gdzie wielkość Z jest zwiększenie znak X jest pozytywne i poniżej 3,75 MHz, gdzie wielkość Z zmniejsza się znak "X" jest
negatywny. On the VNA1 and miniVNA displays the trace line for X would always be
positive, with a "V" in the middle, but this illustrates that the
technique sometimes holds true. Na VNA1 i miniVNA
wyświetla śladów linii X będzie zawsze pozytywne, a "V" w środku, ale
to pokazuje, że czasami odnosi się techniką.
However, if the same antenna were to be measured at the
input end of 50 feet of RG-213 (chosen just as an example) the situation is not
so clear. Jednakże, jeśli te same anteny miały być mierzona na koniec
wejściowe
Here the magnitude of Z is increasing in the frequency
range from 3.5 to just less than 3.7 MHz. Tutaj wielkości Z wzrasta w
zakresie częstotliwości od 3,5 do zaledwie mniej niż 3,7 MHz.
In that range the sign of X is positive, as expected
when Z magnitude increases. W tym zakresie znak X jest pozytywny,
zgodnie z oczekiwaniami, gdy Z skali podwyżek. But
the Z magnitude is decreasing from there until 4 MHz and in that span
the sign of X is still positive for a while, then goes negative, then goes
positive again. Z wielkości, ale zmniejsza się stamtąd do 4 MHz i w tym span znak
"X" jest nadal pozytywny wpływ na jakiś czas, potem wychodzi
negatywny, a potem znowu pójdzie pozytywne. So
if you did not know the sign of X and you used the simple "Z mag goes down
means X is negative" you would be wrong over much of the frequency range.
Więc jeśli nie wiesz znak X i używaliśmy prostych "Z mag idzie w dół
oznacza X jest negatywna" ty byłby zły nad znaczna część częstotliwości.
Another technique for resolving the sign of X involves
looking at the slope of the reflection coefficient phase angle. Innej
techniki rozwiązywania znak X polegało na stoku refleksji współczynnik fazy
kąta. This also works in simple cases, but not for this
example of taking measurements at the input end of a feedline. To
również działa w prostych przypadkach, ale nie dla tego, biorąc przykład z
pomiarów na koniec wejście na feedline.
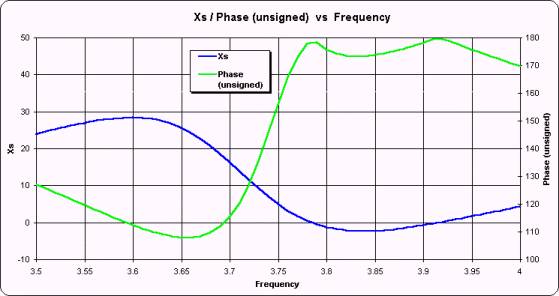
This plot shows X, both positive and negative,
referenced to the left scale as before. Ta fabuła pokazuje, X, zarówno
pozytywnych jak i negatywnych, o których mowa w lewo skalę jak przedtem.
The green line shows Phase, referenced to the right
scale. Zielona linia pokazuje fazy, odwołuje się do prawa skalę. The
Phase values have been artificially altered to be unsigned, the same as would
be shown on the VNA1 and miniVNA displays, except for clarity the scale range
has been limited to
Below is a slightly more complicated measurement
example, shown on Smith charts instead of XY charts. Poniżej znajduje
się nieco bardziej skomplikowanych pomiarów przykład, pokazano na wykresach
Smith zamiast wykresów XY.
|
|
|
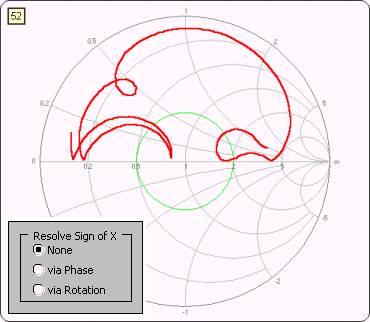
Here is what the Smith
chart looks like when the sign of X is always positive. Oto co Smith wykres wygląda, gdy znak "X" jest
zawsze pozytywne. This is the 20M/15M trap dipole measured via 23 feet of RG-58 used in
previous illustrations. To jest
pułapka 20M/15M dipola
mierzona 23 rodzajów stóp RG-58 używane w poprzedniej ilustracji.
It is possible to make some "educated
guesses" about the sign of X and Zplots has logic to do that. When
you display VNA1 and miniVNA data with Zplots you will have three
options for how you want to resolve the sign of X. The "None"
option (at left) means to show the sign of X as always positive, the same as
it is displayed on the VNA1 or miniVNA software. Możliwe jest
dokonanie pewnych "wykształconych odgadnięcia" o znak X i Zplots ma logiki to zrobić. Wyświetlanie VNA1 i miniVNA danych z Zplots
będziesz miał trzy opcje, jak chcesz rozwiązać znak X. " Brak
"opcja (po lewej) oznacza pokazać znak X, jak zawsze pozytywne, tak samo
jak ona wyświetlana na VNA1 lub miniVNA
oprogramowania. |
|
|
|
Here is exactly the
same data as reported by the VNA1 or miniVNA device, except that one of two
possible Zplots algorithms has been applied to determine the sign of
X. Tutaj jest dokładnie taki sam
jak dane zgłoszone przez VNA1 lub miniVNA
urządzenia, chyba że jeden z dwóch możliwych Zplots algorytmów została zastosowana do ustalenia
znak X. The "Phase" option looks for places where
the Phase angle approaches 0 or 180 degrees and then does further processing
to determine the correct sign for X. This option works in most cases and is
the one you should try first. "Fazy" opcja szuka miejsca,
gdzie fazy kąta podejścia 0 lub 180 stopni, a następnie nie dalszego
przetwarzania w celu ustalenia prawidłowej znak X. Ta opcja działa w
większości przypadków i jest to pierwsze powinieneś spróbować. The "Rotation" option works on the principal
that the Smith chart trace should always rotate in a clockwise direction as
the frequency increases. W "Obrót" opcja działa na główne,
że Smith wykres śladu powinien obracać zawsze w kierunku ruchu wskazówek
zegara, co zwiększa częstotliwość. This option works even if
the Phase angle does not approach 0 or 180 degrees but does not handle cases
where the Smith trace has "closed loops" that are not centered on
the middle of the chart, as at left. Opcja ta działa nawet wtedy, gdy
fazy kąta nie podejście 0 lub 180 stopni, ale nie obsługuje przypadkach, gdy
Smith ma śladu "zamkniętych pętli", które nie są umieszczane na
środku wykresu, na lewo. |
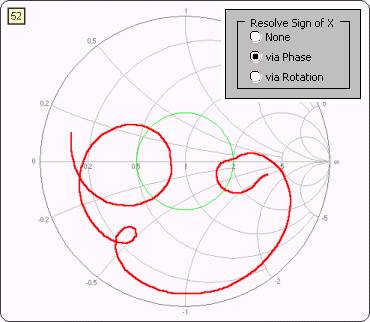
For relatively simple cases either method will work.
Do stosunkowo prostych przypadkach, albo metoda będzie działać. For
extremely complex cases, such as measuring a multi-band antenna over a very
wide frequency range, neither method may work. Do niezwykle
skomplikowanych przypadkach, takich jak pomiaru multi-pasmowe
anteny w bardzo szerokim zakresie częstotliwości, metoda może nie działać.
If you see "up-down jumps" on the Smith chart,
where the sign of X swings rapidly between positive and negative values, it
means that the sign of X was not determined correctly. Jeśli widzisz
"góra-dół przeskoczył" na wykresie Smitha, gdy znak X szybko huśtawki
między dodatnie i ujemne wartości, oznacza to, że znak X nie została ustalona
prawidłowo. It is amazingly easy for the human eye to see these
shifts, and surprising difficult for a "blind" computer program to do
the same. To jest zdumiewająco łatwy dla oka ludzkiego, aby zobaczyć te
zmiany, zaskakujące i trudne do "ślepe" program komputerowy do tego
samego.
You will see the three option buttons only when the
input data to Zplots comes from either the VNA1 or miniVNA analyzer.
Zobaczysz trzy przyciski opcji tylko wtedy, gdy dane wejściowe do Zplots pochodzi albo VNA1 lub miniVNA
analizatora. If you choose one of the correction algorithms the
corrected sign will also be shown on the various traces of the Custom XY chart
that are dependent on the correct sign of the reflection coefficient angle,
including Xs, Theta, Phase, and others. Jeśli wybierzesz jeden z
algorytmów korekcji poprawiony znak będzie również pokazany na różne ślady
niestandardowe wykresie XY, które są zależne od prawidłowego znakiem refleksji
współczynnik kąta, w tym XS, Theta, fazy, i inne.
Changing trace line
colors and other visual aspects of the charts: Zmiana kolorów linii śladu i inne aspekty z wizualnych
schematów:
![]() Zplots has built-in "Color Dot" buttons
that allow you to easily change the colors for the chart trace lines, the
frequency marker line/dot, the SWR circle on the Smith charts, and the
horizontal reference lines on the Custom XY chart. Zplots
ma wbudowaną "Kolor Dot" przycisków, które
umożliwiają łatwą zmianę kolorów na wykresie śladów linii, częstotliwość linii
znacznika / kropki, w kółku na SWR Smith wykresy i poziomej linii odniesienia
na wykresie XY niestandardowej. These buttons are visible
only when the associated item is being displayed. Przyciski te są
widoczne tylko wtedy, gdy wiąże się element jest wyświetlany. For
example, if you are not currently plotting anything on the XY secondary (right)
axis then the color button for that trace line is not shown. Na
przykład, jeśli nie są aktualnie wykreślania czegokolwiek na XY wtórnym (po
prawej) osi następnie przycisku koloru dla linii śladu, że nie jest wyświetlana.
Zplots has built-in "Color Dot" buttons
that allow you to easily change the colors for the chart trace lines, the
frequency marker line/dot, the SWR circle on the Smith charts, and the
horizontal reference lines on the Custom XY chart. Zplots
ma wbudowaną "Kolor Dot" przycisków, które
umożliwiają łatwą zmianę kolorów na wykresie śladów linii, częstotliwość linii
znacznika / kropki, w kółku na SWR Smith wykresy i poziomej linii odniesienia
na wykresie XY niestandardowej. These buttons are visible
only when the associated item is being displayed. Przyciski te są
widoczne tylko wtedy, gdy wiąże się element jest wyświetlany. For
example, if you are not currently plotting anything on the XY secondary (right)
axis then the color button for that trace line is not shown. Na
przykład, jeśli nie są aktualnie wykreślania czegokolwiek na XY wtórnym (po
prawej) osi następnie przycisku koloru dla linii śladu, że nie jest wyświetlana.
|
|
|
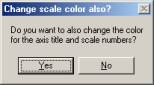
When you change the
color for either the left or right axis trace line on the Custom XY chart you
will also be given a choice to change the color of the scale numbers and axis
title. Po zmianie koloru na
lewej lub prawej osi śledzenia linii na wykresie XY Custom
będziesz także mieć możliwość zmiany koloru na skalę i liczbie osi tytuł.
Choose "Yes"
and the text color will match the trace color. Wybierz "Tak" i kolor tekstu będzie dopasować
kolor śladu. Choose "No" and the text will be standard black.
Wybierz "Nie", a tekst będzie
standardowy czarny. |
||
|
|
|
To change things like
the background fill color of the charts you can use the standard Excel user
interface. Aby zmienić rzeczy,
takie jak kolor wypełnienia tła z wykresów można użyć standardowego
interfejsu użytkownika programu Excel. In most cases the easiest
way to do that is to hover your mouse pointer over the item to be changed and
verify that the "Chart Tips" box shows what you intend to change,
such as "Chart Area" for the outer area of the chart or "Plot
Area" for the inner area. W
większości przypadków najprostszym sposobem, żeby zrobić to hover wskaźnika myszy na element, który ma być zmieniony
i sprawdzić, czy "Wykres Sztuczki" pole pokazuje to, co masz zamiar
zmiany, takie jak "Wykres Powierzchnia" na zewnętrznej powierzchni
wykresu lub "działka Powierzchnia" dla strefy wewnętrznej.
Then hold down the Alt
key, RIGHT click the mouse, and choose "Format ..." Następnie przytrzymaj wciśnięty klawisz Alt, kliknij
prawym klawiszem myszy myszki i wybrać "Format ..." from the context menu that will appear. z menu kontekstowego, które będą wyświetlane.
Usually 'Patterns' is
the tab you will want to select in the dialog box that will follow.
Zwykle "Patterns"
to kartę możesz wybrać w oknie dialogowym, które nastąpią. Make changes as
desired. Wprowadzić zmiany do
swoich potrzeb. When you are done just click outside the chart boundary to return to
a normal state. Po zakończeniu
wystarczy kliknąć poza granicę wykresu, aby powrócić do normalnego stanu.
(Holding down the Alt
key when you click on a chart signals Zplots that you do not
want to show or change the frequency marker.) (Trzymając wciśnięty klawisz Alt po kliknięciu na
wykresie Zplots sygnały, że nie
chcesz wyświetlić lub zmienić częstotliwość markera). |
||
|
|
|
Of course, once you
start playing around with the visual aspects of the charts you may get
carried away. Oczywiście, po
uruchomieniu gry z około wizualnego aspekty wykresy można dać się ponieść
nerwom. (Press Esc to calm the
nervous cat.) (Naciśnij klawisz Esc, aby spokój nerwowy kota.) |
Important: You may wish to keep a backup copy of Zplots
if you intend to experiment with various format changes. Ważne: Jeśli chcemy zachować kopię zapasową Zplots jeśli masz zamiar eksperymentować z różnymi
zmiany formatu. If you are not very familiar with Excel it is possible
that you may make changes from which you don't know how to recover, or which
cause Zplots to fail. Jeśli nie jesteś zaznajomiony z Excel
bardzo możliwe jest, że można dokonać zmian, z których nie wiesz, jak odzyskać,
lub które powodują Zplots
na porażkę. If that happens just close the Zplots workbook
(File | Close, without saving) and you will be back to where you started.
Jeśli to się dzieje, po prostu zamknij skoroszyt Zplots
(Plik | Zamknij, bez zapisywania) i będziesz z powrotem do miejsca, gdzie można
rozpocząć. If you have already saved your changes and get into
trouble, you can always start fresh with the backup copy that you made.
Jeśli masz już zapisane zmiany i popadły w kłopoty, zawsze możesz zacząć świeże
z kopii zapasowej, że dokonane.
Optional - Using
'Zplots+' to control the miniVNA hardware: Opcjonalnie - Korzystanie z "Zplots
+", aby kontrolować miniVNA sprzętu:
|
|
|
An enhanced version of Zplots
called Zplots+ can be used to control the operation of the miniVNA
device. Udoskonaloną wersją Zplots nazwie Zplots + mogą być używane do
kontroli operacji z miniVNA urządzenia.
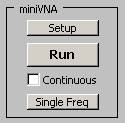
Begin by clicking the
"Setup" button. Rozpocząć,
klikając przycisk "Ustawienia" znajdujący się. |
|
|
|
Start at the bottom of
the dialog window, in the "Other Setup" area. Rozpocznij w dolnej części okna dialogowego, w
części "Inne Instalator" obszaru. Enter the port number
that corresponds to the Next move up to the "Mode" area.
Następna przenieść do "Tryb" obszaru. You will probably want to use a different Zero Adjust
value than the default of 0. Zplots+ can set both the Reflection and
Transmission mode zero adjust values for you automatically if you so choose.
Prawdopodobnie będzie chciał skorzystać z różnych Zero Regulacja niż domyślna
wartość 0. Zplots + można ustawić
zarówno w trybie Przekazanie refleksji i dostosowania wartości zero dla
Ciebie automatycznie, jeśli tak zdecydują. Just click the small "AutoSet" button and
follow the instructions. Wystarczy kliknąć na małe "AutoSet" i postępuj zgodnie z instrukcjami. For Reflection mode you will be asked to place a short
on the DUT port. Do refleksji trybie zostaniesz poproszony o miejsce
na krótki DUT portu. A resistor wire lead,
held in place with your finger, will do fine. Zplots+ will take a
single-point reading and calculate what the zero adjust value should be. The
procedure for Transmission mode is similar except that you have to place a
short jumper between the DUT and DET ports. A rezystor drut ołowiu,
która odbyła się w miejscu, z palcem, to będzie dobrze. Zplots
+ weźmie pojedynczy punkt czytania i obliczyć, jakie wartości zerowej
należy skorygować. Procedurę Przekazanie tryb jest podobny chyba, że masz do
miejsca krótkim skoczka między DUT i DET portów. When finished you are free to manually change the zero
adjust value and/or have Zplots+ set it at a different frequency.
Po zakończeniu pojawi się swobodnie zmieniać ręcznie skorygować wartość zero
i / lub Zplots + ustawić ją na inną
częstotliwość. When you close and save the Zplots+ workbook
your zero adjust and port number settings will be saved. Po zamknięciu
i zapisać skoroszyt Zplots +
dostosować swoje zera i numer portu ustawienia zostaną zapisane. |
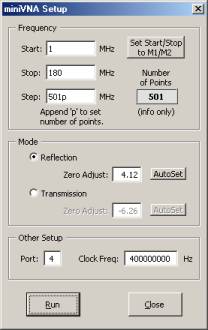
Finally, move up to the "Frequency" area and
enter desired values for frequency start, stop, and step size. Wreszcie,
należy przenieść do "Pasmo" i wpisz żądane wartości częstotliwości
uruchomić, zatrzymać, a wielkość kroku. The Number of Points
box will be recalculated automatically as you are making changes to the
frequency range or step size. If you don't care about the frequency step size
in MHz you can specify the number of points in the scan by putting a 'p' after
the number in the "Step" box. Liczba punktów pole
zostanie ponownie obliczona automatycznie podczas dokonywania zmian w zakresie
częstotliwości lub wielkości kroku. Jeśli nie dbają o częstotliwość w MHz Wielkość kroku możesz określić liczbę punktów
skanowania przez umieszczenie 'p "Po numerze w" Krok "polu.
That is, if you want 100 data points enter
"100p" (no quotes) in the box. To znaczy, jeśli chcesz wpisać
100 punktów danych "100p" (bez cudzysłowu) w polu. Note
that using the 'p' option may result in some very odd frequency steps between
the Start and Stop frequencies. Należy pamiętać, że korzystając z
"p" opcja może spowodować bardzo nieparzyste częstotliwość kroków
między start i stop częstotliwości.
If you want to duplicate the default miniVNA scan
conditions use Start: 1, Stop: 180, and Step 501p. Jeśli chcesz duplikat
domyślnej miniVNA skanowania warunki wykorzystania
Start: 1, Przystanek: 180 i 501p Krok. Use 501p, not 500p, because
Zplots+ includes the start frequency in the scan. Zplots+ will
allow up to 2047 points in a scan, so you can (for example) enter values of 1,
180, and 0.1 for 1791 points. Użyj 501p, 500p nie, ponieważ zawiera Zplots + początku częstotliwość skanowania. Zplots + pozwoli do 2047 punktach w
skanowanie, dzięki czemu można (na przykład) wartości wpisz 1, 180, i 0,1 na
1791 punktów. You are not limited to 500 points and the number of
points is dynamic. Użytkownik nie jest ograniczony do 500 punktów, a
liczba punktów jest dynamiczne.
Note that there is a speed versus accuracy trade-off
when setting the step size (or number of points). Należy pamiętać, że
istnieje handel dokładność prędkości w porównaniu do startu przy ustalaniu
wielkości kroku (lub liczbę punktów). Smaller step sizes (greater
number of points) will produce more accurate results but the processing will
take a little longer. Krok w mniejszych rozmiarach (większa liczba
punktów) będą produkować więcej dokładne wyniki, ale będzie trochę dłużej.
In general you should use a step size of 0.5 MHz or
less. W ogóle należy użyć krok rozmiar 0,5 MHz
lub mniej.
The "Set Start/Stop to M1/M2" button can be
used as a convenient way to scan just in the frequency range between the
current marker positions. W "Set Start / Stop, aby M1/M2"
przycisk ten może być stosowany jako wygodny sposób do skanowania tylko w
zakresie częstotliwości pomiędzy obecnych znacznik miejsca. The
button will be enabled only when both markers are present. Przycisk
będzie możliwa tylko wtedy, gdy są obecne zarówno markerów.
When you click "Run" Zplots+ will send
the appropriate commands to the miniVNA, read the results, write the data to a
temporary file named '$Zplots$Scan.csv', then automatically load that file just
like any other data file. Po kliknięciu "Uruchom" Zplots + wyśle odpowiednie komendy do miniVNA, zapoznaj się z wyników, wpisz dane do pliku
tymczasowego o nazwie "$ Zplots $ Scan.csv", a następnie
automatycznie załadować ten plik podobnie jak wszelkie inne dane pliku. If
you want to save the scan data click on the Excel File menu and choose the
"Zplots: Save Scan As..." Jeśli chcesz zapisać zeskanowane dane w programie Excel kliknij menu Plik i
wybierz "Zplots: Scan
Zapisz jako ..." entry. wpisu.
Important: You cannot have the miniVNA software
running at the same time as Zplots+ . Ważne: Nie można
mieć miniVNA oprogramowanie uruchomione w tym samym czasie co Zplots +.
The miniVNA software will keep the
If you want to repeat a scan using the same frequency
settings you can bypass the "Setup" step and just click the large
"Run" button that is present on both the Custom and Smith sheets.
Jeśli chcesz powtórzyć skanowanie przy użyciu tych samych ustawień
częstotliwości można pominąć "Instalator" krok i po prostu kliknij na
duży przycisk "Uruchom" przycisk, który jest obecny na obu
niestandardowe i Smith arkuszy. And if you want to have the
scanning repeated, perhaps while you make adjustments to the DUT such as
changing a wire position or a tuner setting, check the "Continuous"
box. A jeśli chcesz mieć skanowania powtarzać, być może podczas dokonać
korekt do DUT takich jak zmiana pozycji drutu lub tunera ustawienie, zaznacz
"Ciągłe" polu. The scans will be repeated
until you uncheck the box or click the "Halt" (was "Run")
button. Skanów będą powtarzane, aż zostanie
usunąć zaznaczenie pola wyboru lub kliknij przycisk "Halt"
(było "Uruchom") przycisk. While in continuous scan
mode you can still interact with the charts, changing the drop down selections
or placing and moving markers, although the response will be delayed.
Podczas gdy w trybie ciągłego skanowania można nadal oddziaływać z wykresów,
zmiana listy rozwijanej wyboru lub wprowadzania i ruchomych markerów, chociaż
reakcja będzie opóźniona.
|
|
|
Zplots+ also has a
"Single Frequency" function for the miniVNA, controlled by the
dialog window shown here. Zplots + posiada również
"Single częstotliwości" dla funkcji miniVNA,
kontrolowane przez okna dialogowego pokazano tutaj. When you click
"Run" the program will continuously poll a single frequency and
post the results, mostly as numbers but in a few cases augmented with bar
graphs. Po kliknięciu
"Uruchom" program będzie stale sonda jednym częstotliwości i po
wynikach, głównie jako numery, ale w kilku przypadkach zwiększona o wykresy
słupkowe. For the RL/TL and Phase bars you can choose between two different
full-scale levels. Do RL / TL i
fazy barów można wybrać między dwoma różnymi poziomami pełną skalę.
The polling will continue until you click
"Halt" (was "Run") or close the window, so you can use
both hands to make adjustments to the DUT if desired. Lokali
wyborczych będzie nadal, dopóki nie klikniesz "Halt"
(było "Uruchom") lub zamknąć okno, dzięki czemu można używać obu
rąk w celu dokonania dostosowań do DUT w razie potrzeby. Under Excel 97, because of a limitation in that
version of Excel, the polling is done about once per second. W ramach
programu Excel 97, ze względu na ograniczenia w tej wersji programu Excel,
obwodów odbywa się około raz na sekundę. Under Excel 2000 and higher the rate is about 4 times
per second. W ramach programu Excel 2000 oraz wyższy wskaźnik jest
około 4 razy na sekundę. There is no screen
flicker although you may see the various values change in small amounts even
for the same frequency. Nie ma migotanie ekranu, choć może pojawić się
różne wartości zmian w niewielkich ilościach nawet do tej samej
częstotliwości. The red/green status indicator tells you whether or
not polling is taking place. Czerwony / zielony wskaźnik stanu powie
Ci, czy obwodów ma miejsce. |
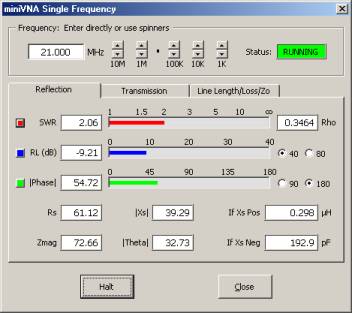
|
|
|
A specialized
application of the "Single Frequency" function lets you easily
determine the characteristics of a transmission line. A wyspecjalizowane stosowania "Single
Pasmo" funkcja pozwala łatwo określić cechy charakterystyczne dla linii
przesyłowych. After setting the desired frequency and entering either the velocity
factor or physical length for the line, click the "Run" button.
Po ustawieniu żądanego i częstotliwość
wprowadzanych albo prędkości czynnika fizycznego lub długość linii, kliknij
przycisk "Uruchom" button. You will be asked to
first terminate the line with a short circuit, then an open circuit. Zplots+
will make a series of measurements and report the results. Zostaniesz poproszony o zakończeniu pierwszej linii
z zwarcie, a następnie otwartym obwodzie. Zplots
+ będzie dokonać serii pomiarów i sprawozdanie z wyników. The algorithm used to
determine line loss is not dependent on the impedance of the line (50 ohms,
75 ohms, etc.) so you may measure lines of any impedance. Algorytm stosowany do oznaczania linii strat nie
jest zależne od impedancji linii (50 omów, 75 omów, itp.) może być środek
linii wszelkich impedancji. Keep in mind that the velocity factor for any line is
not a constant but in fact increases by a small amount as the frequency increases.
Należy pamiętać, że prędkość czynnikiem dla każdej linii nie jest stała, ale
w rzeczywistości zwiększa się o niewielką kwotę co
zwiększa częstotliwość. Because of small
inaccuracies in determining the line length you may or may not be able to see
this trend when you measure the same line at increasingly higher frequencies,
but you probably will notice that, for example, the length of the line in
wavelengths is not exactly doubled when you double the measurement
frequency. Ze względu na małe nieścisłości w określaniu długości linii
może być lub może nie być w stanie zobaczyć tę tendencję, jeśli środek ten
sam wiersz na coraz wyższe częstotliwości, ale prawdopodobnie będzie
zauważyć, że, na przykład, długość linii w zakresie długości fali nie jest dokładnie
podwoiła się dwukrotnie podczas pomiaru częstotliwości. |
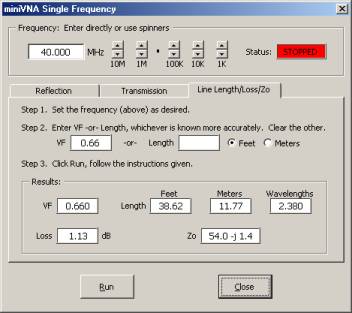
Zplots+ works only with hardware that is
controlled via the USB-COM port, not the LPT port. Zplots
+ działa tylko ze sprzętem, który jest kontrolowany za pomocą portu USB-COM, a nie port LPT. That
means that it works only with the miniVNA device unless you have done the
"SP3SWJ modification" to your older VNA1 hardware to control it via
the USB-COM port. Zplots+ will not control the (unmodified) original
VNA1. Oznacza to, że to działa tylko z miniVNA
urządzenia, chyba że masz do zrobienia "SP3SWJ
zmiany" na swoje starsze VNA1 sprzętu do sterowania za pomocą portu USB-COM. Zplots +
nie będzie kontroli (niemodyfikowanych) oryginał VNA1.
For details on modifying the original VNA1 see the
(Polish language) SP3SWJ web page . Szczegółowe informacje na temat
modyfikowania pierwotnego VNA1 zobaczyć (język polski) SP3SWJ stronie internetowej.
Optional - Using
'Zplots-AIM' to control the AIM hardware: Opcjonalnie - Używanie "-Zplots
AIM" do kontroli sprzętu AIM:
|
|
|
An enhanced version of Zplots
called Zplots-AIM can be used to control the operation of the AIM
device. Udoskonaloną wersją Zplots nazwie Zplots-CEL
mogą być używane do kontroli funkcjonowania AIM urządzenia. |

|
|
|
You'll see two buttons
in the "AIM" frame: "Limits" is pretty much the same as
the AIM Limits window and "Scan" does a scan using the whatever the
current limits are just like the AIM Scan button. Zobaczysz dwa przyciski do "AIM" ramce:
"Granice" jest niemal tak samo jak AIM Granice okna i "Scan" nie skanowania przy użyciu niezależnie od
obecnych granicach są podobnie jak AIM przycisku
Skanuj. |
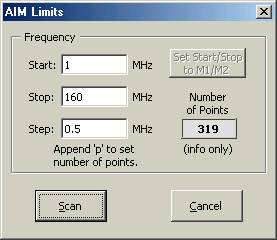
To use the Zplots-AIM interface: Aby korzystać z Zplots AIM-interfejsu:
- Start the AIM software (version 561 or higher) in a
separate window. Start AIM oprogramowania (w wersji 561 lub
wyższej) w oddzielnym oknie. Leave that window up
and then switch back to the Excel window with Zplots. , Aby opuścić
okno, a następnie przełączyć się z powrotem do okna programu Excel z Zplots.
- Set the scan limits as desired, using the Zplots-AIM
"Limits" button. Ustaw jako pożądanego ograniczenia
skanowania, za pomocą Zplots-AIM
"Granice" button. The Number of Points box will be
recalculated automatically as you are making changes to the frequency
range or step size. If you don't care about the frequency step size in MHz
you can specify the number of points in the scan by putting a 'p' after
the number in the "Step" box. Liczba punktów pole
zostanie ponownie obliczona automatycznie podczas dokonywania zmian w
zakresie częstotliwości lub wielkości kroku. Jeśli nie dbają o
częstotliwość w MHz Wielkość kroku możesz
określić liczbę punktów skanowania przez umieszczenie 'p "Po numerze
w" Krok "polu. That is, if you want
100 data points enter "100p" (no quotes) in the box. To
znaczy, jeśli chcesz wpisać 100 punktów danych "100p" (bez
cudzysłowu) w polu. Note that using the
'p' option may result in some very odd frequency steps between the Start
and Stop frequencies. Należy pamiętać, że korzystając z
"p" opcja może spowodować bardzo nieparzyste częstotliwość
kroków między start i stop częstotliwości.
- Click the "Scan" button. Kliknij przycisk "Scan" button.
- The first time you use the Zplots-AIM automated
interface you'll be prompted to navigate to the AIM folder and
double-click on any file in that folder. Po raz pierwszy używasz Zplots AIM-zautomatyzowany
interfejs zostanie wyświetlony monit, aby przejść do AIM folder i kliknij
dwukrotnie na dowolny plik z tego folderu. Zplots will then keep track of the folder name for
future use. Zplots będzie śledzić nazwę
folderu do użytku w przyszłości.
- Zplots will check to make sure that the AIM program
is running and that the version is 561 or higher. Zplots będzie sprawdzić, aby upewnić się, że celem
programu jest uruchomiony i że jest w wersji 561 lub wyższej. If AIM is not currently running you'll get a gentle
reminder. Jeśli celem jest aktualnie nie działa Ci delikatne
otrzymać przypomnienie.
- Zplots will make AIM the active window, send
keystrokes to set the AIM scan limits to match whatever you set in Zplots,
then send a special hot-key command. Zplots
pozwoli AIM aktywnego okna, wysyłać sekwencje klawiszy, aby ustawić AIM skanowania
do meczu bez ograniczeń można ustawić w Zplots,
a następnie wysłać specjalny klucz gorąco komenda. AIM will do a scan and write a temporary file named
'$AutoScan$.csv' to the AIM home folder. AIM nie będzie skanowania
i zapisu tymczasowy plik o nazwie "$ $ AutoScan.
Csv" AIM do katalogu domowego. (That's why Zplots needs to know what the folder
is.) Important: If you are using Zplots-AIM under the
Windows Vista operating system you must disable User Account Control or
else you will get run-time errors (Error 90) at this point. (That's why Zplots musi wiedzieć, co jest folder.) Ważne:
Jeśli używasz Zplots-CEL w ramach systemu
operacyjnego Windows Vista należy wyłączyć User Account Control lub inny otrzymasz run-time
błędów (Error 90) w tym momencie
.
- Zplots will read the temporary '$AutoScan$.csv'
file and plot the data. Zplots będzie
czytał czasowego "$ $ AutoScan. Csv" pliku i działki danych.
- If you want to repeat the scan using the same
Start/Stop/Step just click the large "Scan" button in the "AIM"
frame. Jeśli chcesz powtórzyć skanowanie przy użyciu tego samego
Start / Stop / Krok po prostu kliknij na dużą "Scan"
w oknie "AIM" klatkę. No need to bring up
the "Limits" window again. Nie ma potrzeby dostosowania
się "Granice" okno ponownie.
- If you want to permanently save the scan data just
switch back to the AIM window and select File | Save Graph from the AIM
menu bar, as you would normally do to save a scan. Jeśli chcesz
trwale zapisać zeskanowane dane wystarczy
przełączyć się z powrotem do okna AIM i wybierz Plik | Zapisz wykres z AIM
pasek menu, tak jak robisz to normalnie zapisać skanowania. AIM will then save the data in both *.scn and *.csv
formats using whatever file name you specify. Celem następnie
zapisanie danych w obu *. scn
i *. csv formatów za
pomocą dowolnej nazwy pliku, który określisz.
There's an additional button, disabled by default, in
the Zplots "Limits" dialog window. Nie dodatkowy przycisk,
domyślnie wyłączone, w Zplots "Granice"
okno dialogowe. The button is named "Set Start/Stop to M1/M2".
Przycisk o nazwie "Set Start / Stop, aby M1/M2". M1
and M2 refer to Marker 1 and Marker 2. M1 i M2 odnoszą się do Marker 1 i
Marker. 2. If desired, set Marker 1 by left clicking on the trace
and set Marker 2 by right clicking. W razie potrzeby, ustawić Marker 1 przez klikając lewym przyciskiem myszy na śledzenie
i zestaw Marker 2, klikając prawym przyciskiem myszy. When/if
both markers are set the new button will be enabled. Gdy / jeśli są
zarówno markerów ustawić nowy przycisk zostanie włączony. If
you click the button the Start/Stop will be set to whatever frequencies the
markers are set to. Po kliknięciu przycisku Start / Stop, będzie
ustawiony na częstotliwości bez znaczników są ustawione. So
you can do a broad scan, see the big picture, put the markers around a
frequency range of interest, click "Limits" and then click "Set
Start/Stop ...", do a new scan, and the new scan will be just at the
narrower frequency range. Więc możesz to zrobić szeroki skanowania,
zobaczyć duży obraz, umieścić znaczniki wokół częstotliwości zainteresowania,
kliknij przycisk "Granice" a następnie kliknąć przycisk "Set
Start / Stop ...", zrobić nowe skanowanie, a nowy
będzie skanować być tylko w węższym zakresie częstotliwości.
Download:
Pobrano:
Download one of the
following. Free. All require Excel 97 or later.
Pobierz jeden z poniższych. Wolnego. Wymagają Wszystkie Excel 97 lub nowszy.
- Zplots
standard version. Zplots standardowej wersji.
- Zplots+
for use only with the miniVNA device (and includes all the features of the
standard version). Note that Zplots+ assumes that you have already
installed the miniVNA software, including the necessary USB-COM port
device drivers and other required components that are included in the miniVNA Windows software package. Zplots
+ do użytku tylko z urządzenia miniVNA
(i zawiera wszystkie funkcje wersji standardowej). Zauważ, że Zplots + zakłada, że masz już
zainstalowany miniVNA oprogramowania, w tym
niezbędne USB port COM sterowników urządzeń i innych wymaganych elementów,
które są ujęte w w miniVNA Windows pakiet
oprogramowania.
Note for Excel 2007
users: The initial release of Excel 2007 is not 100% backwards compatible
with workbooks created using earlier versions of Excel. Uwaga dla
użytkowników programu Excel 2007: W pierwszej
wersji programu Excel 2007 nie jest w 100% kompatybilne z skoroszytów
utworzonych za pomocą starszych wersji programu Excel. Since
I do not have access to Excel 2007 I cannot test the changes that are required
to operate under Excel 2007. Ponieważ nie mam dostępu do programu Excel
2007 nie mogę przetestować zmiany, które są wymagane do działania w ramach
programu Excel 2007. However, Jochen, DG1PSI,
has had some success in modifying Zplots+ to be compatible with Excel 2007.
Jednakże, Jochen, DG1PSI, miał pewne sukcesy we
zmodyfikowanie Zplots +, które mają być zgodne z
Excel 2007. For more info and a free download see the DG1PSI homepage . Aby uzyskać więcej informacji i
pobrać bezpłatny zobacz DG1PSI stronie głównej.
- Zplots-AIM
for use only with the AIM device (and includes all the features of the
standard version). Note that Zplots-AIM requires that your AIM
software be version 561 or later. Zplots-AIM
do użytku jedynie w celu urządzenia (i zawiera wszystkie funkcje wersji
standardowej). Zauważ, że Zplots AIM-wymaga, aby Twoje AIM Software być 561 lub nowszej
wersji.
Note for AIM software
version 650 and above users: You must make a modification to the
default AIM configuration file. Uwaga na AIM wersji oprogramowania powyżej
You can also download this web page in PDF format to serve as a basic user
guide. Można również pobrać tę stronę internetową w formacie PDF, aby służyć jako
podstawowy podręcznik użytkownika.
Bodo, DC1DV, has very kindly provided a German language translation of
the user guide. Bodo, DC1DV, ma bardzo uprzejmie dostarczył języka niemieckiego tłumaczenia
instrukcji obsługi. Thank you, Bodo!
Dziękuję, Bodo!
Important: You must allow Excel macros to be
enabled or none of the Zplots buttons will work. Please see Understanding
Excel Macro Virus Warnings for more details. Ważne: Musisz
pozwolić Excel makra, które mają być włączone lub żaden z przycisków Zplots będzie działać. Proszę zobaczyć Zrozumienie
Excel Macro Virus Ostrzeżenia o więcej szczegółów.
Note to international users: You need not make any
changes to your Control Panel Regional Settings for language or number format
in order to use Zplots with the comma-separated-values (*.csv) files
from the programs mentioned above. Zplots will read these files
correctly even though they are formatted with a period as the decimal point and
commas as field separators. Uwaga dla użytkowników międzynarodowych: Nie
musisz dokonywać żadnych zmian do swojego Panelu sterowania Ustawienia
regionalne dla języku lub formacie, w celu wykorzystania Zplots z oddzielone przecinkami wartości (*. csv) z wyżej wymienionych
programów. Zplots będą czytać te pliki
poprawnie, nawet jeśli są formatowane z okresu jako
separator pola i przecinków jako separatorów.
Change history:
Historia zmian:
- Version 1.2, uploaded 3 Sep 2007. Wersja
1.2, uploaded 3
września 2007 roku.
- Support for the s2p format files produced by the
TAPR VNA software. Wsparcie dla formatu plików s2p produkowane
przez TAPR VNA oprogramowania.
- Fixed bug related to saving Snapshot data in an
external file. Naprawiono błąd oszczędności związane z Migawka
danych w zewnętrznym pliku.
- Fixed bug related to recognizing the AIM software
version number. Naprawiono błąd, uznając, związanych z AIM numer
wersji oprogramowania. (Applies to Zplots-AIM
only.) (Dotyczy tylko Zplots-AIM).
- Version 1.1a, uploaded 25 Feb 2007. W wersji
1.1a, przesłany 25 lutego 2007.
- This is the Zplots-AIM package. Jest
to pakiet Zplots-AIM. No other functional changes. Żadnych innych
zmian funkcjonalnych.
- Version 1.1, uploaded 11 Jan 2007. Wersja
1.1, przesłane 11 stycznia 2007.
- Version number shown on the Data sheet along with
web page and email links. Numer wersji widoczny w arkuszu danych
wraz z strony internetowej i e-mail linki.
- Both the Excel window and the workbook window are
maximized on start-up. Zarówno okna programu Excel i skoroszyt zmaksymalizowane okna są na rozpoczęcie działalności.
- Phase (reflection coefficient angle) and Q
(quality factor) added to list of available XY plot items. Faza
(współczynnik odbicia kąt) i Q (współczynnik jakości) dodany do listy
dostępnych pozycji XY plot.
- For the "Add or Subtract Transmission
Line" feature: The dialog window is initially positioned to the
right of the chart, if possible. Do "Dodaj lub Usuń
Przekazanie Linia" funkcja: W oknie dialogowym jest początkowo
umieszczony po prawej stronie wykresu, jeśli to możliwe. The spinner can now change the line length by
+/- 1 or+/- 0.1 in the current units. Pokrętła można teraz zmienić linię długościo +/ - 1 lub +/ - 0,1 w bieżącym jednostki. Less screen flashing when using the spinner. Mniej ekranie miga przy użyciu pokrętła. The amount of line added or subtracted (if any) is shown below the "Add or Subtract" button. Wysokość linii dodaje lub odejmuje (jeśli istnieje) jest pokazany poniżej przycisk "Dodaj lub Usuń" button. - File name shown on print preview and on printed
charts. Nazwa pliku podana na podglądzie wydruku i drukowane na
wykresach.
- "Color Dot" buttons added for convenient
color changes. "Kolor Dot"
przyciski do wygodne dodaje zmiany kolorów.
- Two frequency markers. Częstotliwości dwóch
markerów. Marker1 is controlled by the left mouse button,
Marker2 is controlled by the right mouse button. Marker1 jest
kontrolowana przez lewy przycisk myszy, Marker2 jest kontrolowana przez
prawego przycisku myszy.
- "Zoom M1 to M2" and "Full Freq
Range" buttons added as a convenient way to zoom in on a frequency
range of interest. "Zoom M1 do M2" i "Full Range Freq" dodaje przyciski jako wygodny sposób na
powiększenie w zakresie częstotliwości od zainteresowania.
- Units (MHz, dB, deg, etc.) automatically removed
from the default title on the XY chart. Jednostek (MHz, dB, st., itp.)
automatycznie usuwane z domyślnym tytułem na wykresie XY.
- "Generate Data" button added.
"Generowanie danych" dodano przycisk.
- Support for the csv files produced by the VNA1 and
miniVNA software. Wsparcie dla plików CSV produkowane przez VNA1 i
miniVNA oprogramowania.
- Using Zplots+ , control of the miniVNA
hardware. Korzystanie Zplots +
miniVNA kontrolę nad sprzętem.
- Version 1.0, initial release, 10 Nov 2006.
Wersja 1.0, pierwszej wersji, 10 listopada 2006.

